
In today's fast-paced business world, data is king. With the vast amount of information being generated every minute, it's essential for businesses to have a clear understanding of their data to make informed decisions. Business Intelligence (BI) reporting is a powerful tool that provides valuable insights into business performance. However, unlocking the full potential of BI reporting requires more than just collecting data. It requires a strategic approach that prioritizes data quality, visualization, and interpretation. In this article, we'll explore the top 5 best practices for unlocking the power of business intelligence reporting, including how to set goals, choose the right metrics, and visualize data effectively. Whether you're a small business owner or a CEO of a large corporation, these best practices will help you make data-driven decisions that drive success. So, let's dive in and learn how to leverage the power of BI reporting to take your business to the next level!
What is Business Intelligence?
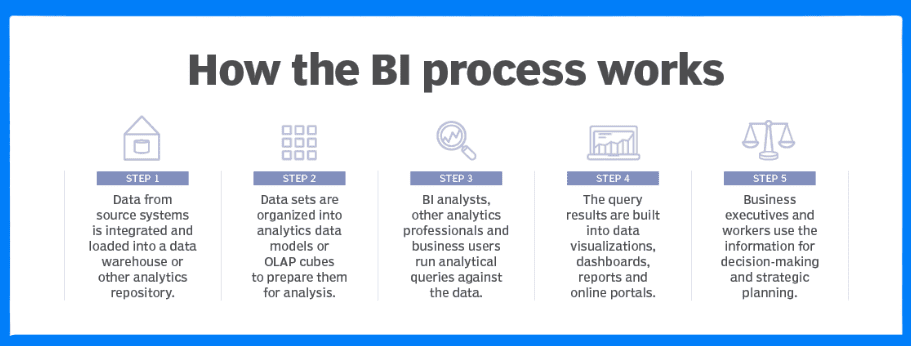
Business intelligence (BI) refers to the process of using data analysis to gain insights into business performance and improve operational efficiency. BI involves the use of various tools and techniques, such as data mining, data visualization, and business analytics, to help organizations make better, data-driven decisions. With BI, businesses can identify trends, patterns, and relationships in their data, which can help them optimize their processes, reduce costs, and increase revenue.
BI tools are designed to access and analyze large data sets from various sources, including databases, spreadsheets, and online platforms. They can present analytical findings in reports, summaries, dashboards, graphs, charts, and maps, which can provide businesses with a comprehensive view of their operations. BI tools can also automate data collection and analysis, which can save time and reduce errors.
Ensuring Data Quality in BI Reporting
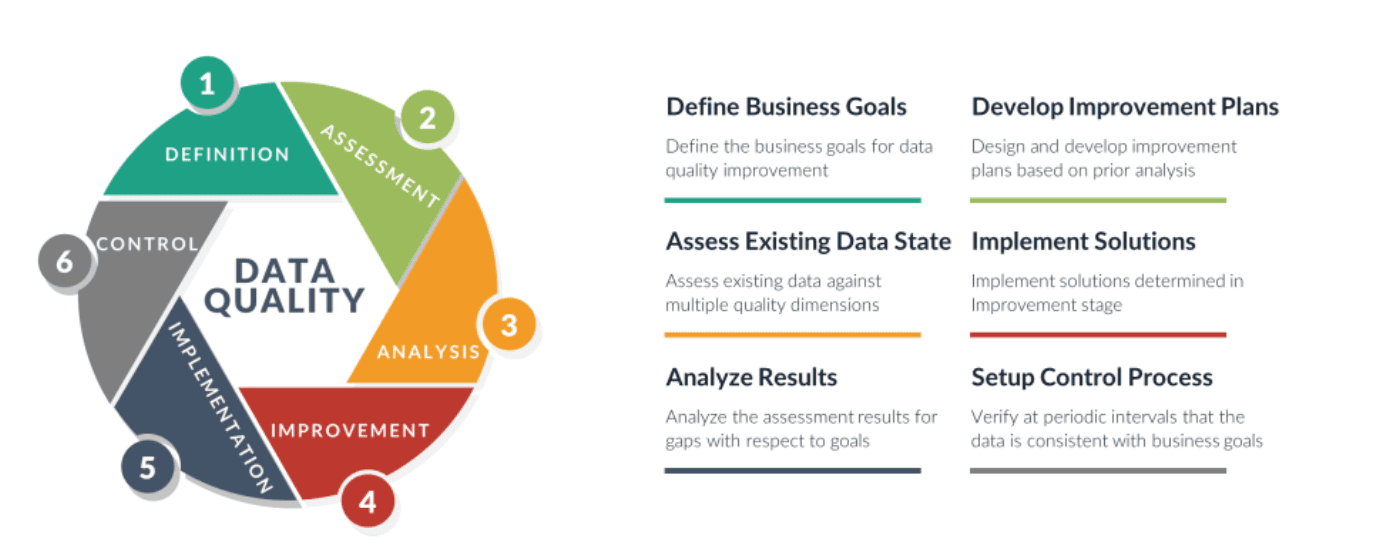
Ensuring data quality in business intelligence is crucial because it directly impacts the accuracy, reliability, and effectiveness of the insights derived from the data. Poor data quality can lead to incorrect conclusions, flawed forecasts, and misguided decisions, which can have serious consequences for a business. There are several reasons why ensuring data quality is essential in business intelligence:
- Improves accuracy: Accurate data is critical for making informed decisions. If data is incomplete, outdated, or inaccurate, it can lead to incorrect conclusions and poor decisions.
Enhances reliability: Reliable data is essential for building trust in the insights generated from BI tools. If data is unreliable, decision-makers may hesitate to act on the insights, which can lead to missed opportunities. Establishing yourself as a reliable source is what all customers value. Maintaining a level of trust is essential while addressing your customers needs.
Reduces risk: Poor data quality can increase the risk of errors, fraud, and compliance issues. By ensuring data quality, businesses can reduce these risks and avoid costly mistakes.
Enhances efficiency: High-quality data can help businesses streamline their operations, reduce costs, and increase productivity. For example, by identifying areas of waste or inefficiency, businesses can optimize their processes and improve their bottom line.
Improves customer satisfaction: By using high-quality data, businesses can gain a better understanding of their customers' needs and preferences, which can help them deliver more personalized and relevant experiences.
Best Practices
Define clear objectives: The first step in creating effective BI reports is to define clear objectives and understand the needs. This involves identifying the business questions that the reports should answer and determining the key performance indicators (KPIs) that will be used to measure success. Start off by listing all the stakeholders, decision makers and end users for your reports. Ask questions to understand how your target audience hopes to use your reports.
Prepare your data: Without clean, accurate data, your reports will be useless. Data cleaning is the process of identifying, correcting, and removing inaccurate, incomplete, or irrelevant data from a dataset. Preparing data is an important step in the data analysis process that involves cleaning, transforming, and organizing the data. This benefits of this include: saving time and resources, increasing analysis efficiency, enhancing data analysis, and facilitating data sharing.
Align reports with business objectives: Ensure that your visualizations align with the business objectives and communicate a clear message. If you're creating a report for a real-estate agency, you may need to include key KPIs like Time on Market, Rental Yield, or Gross Rental Income that could help make the decision-making process easier for them when they're making an investment decision.
Make reports accessible and user-friendly: BI reports should be accessible and user-friendly, so that stakeholders can easily access and interpret the information. This includes making reports available in a variety of formats, such as PDF, Excel, and HTML, and providing interactive features that allow users to drill down into the data and explore it in more detail.
Evaluate and improve: BI reporting is not a one-time task, but an ongoing process. It is important to continuously evaluate and improve the reports to ensure that they remain relevant and useful. This involves monitoring the performance of the reports, soliciting feedback from stakeholders, and making changes as necessary to improve the accuracy, relevance, and usefulness of the reports.

The Role of BI Reporting in Decision-Making
The Role of BI Reporting in Decision-Making
BI (Business Intelligence) reports play a critical role in decision making by providing stakeholders with insights into key business metrics and trends. These reports consolidate data from multiple sources, transforming raw data into meaningful information that can be used to make informed decisions. Here are some of the ways in which BI reports support decision making:
3) Supporting data-driven decision making: provide stakeholders with the data they need to make informed decisions. By basing decisions on data rather than gut instincts, businesses can reduce their risk of making poor decisions and improve their chances of success.
4) Improving collaboration: improve your team's chemistry by providing stakeholders with a shared understanding of key business metrics and trends. This can help to align stakeholders around a common set of goals and objectives.
5) Measuring performance: BI reports can be used to measure performance against key performance indicators (KPIs) and targets. This can help businesses to identify areas for improvement and to track progress towards their goals.
Automate Generated Reports on Zoho Analytics
How to auto-generate reports for an existing table in Zoho Analytics?
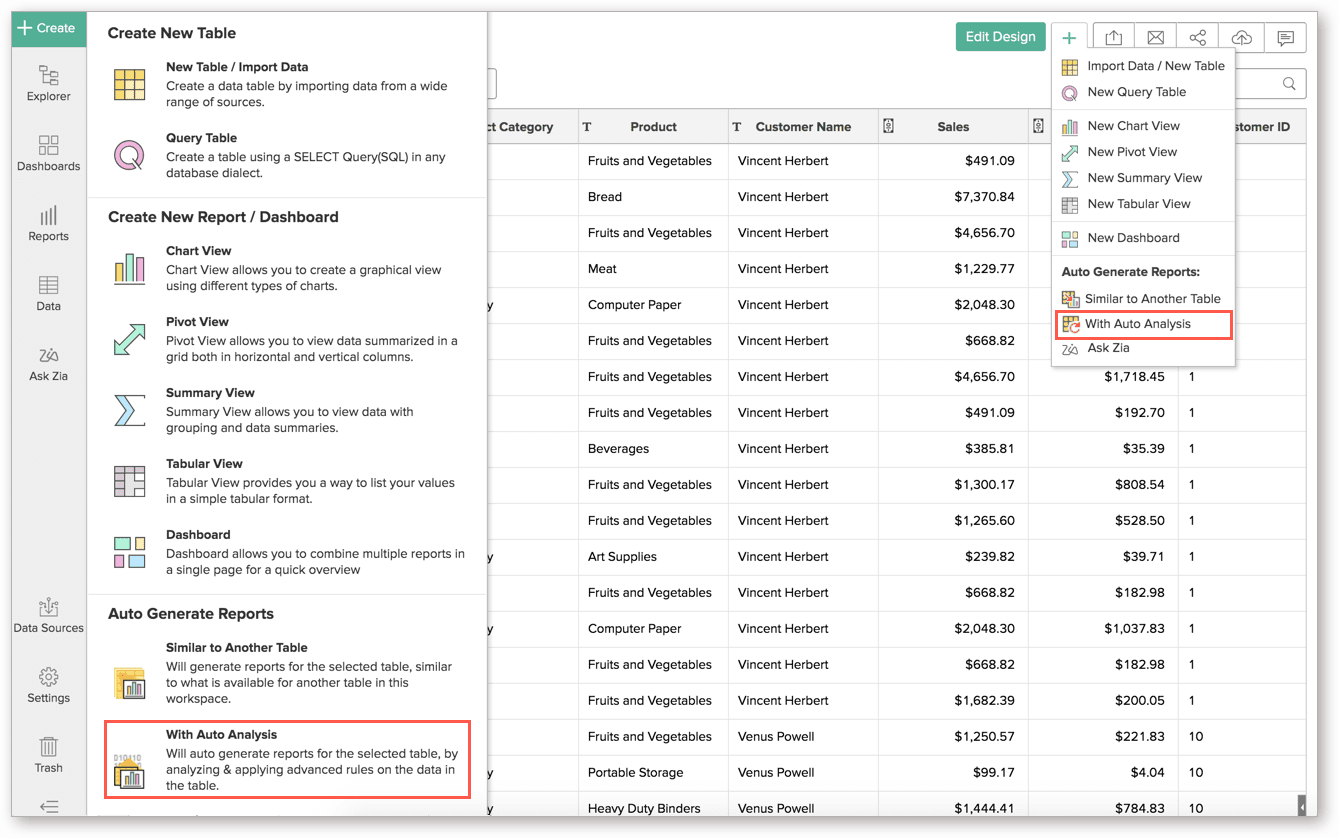
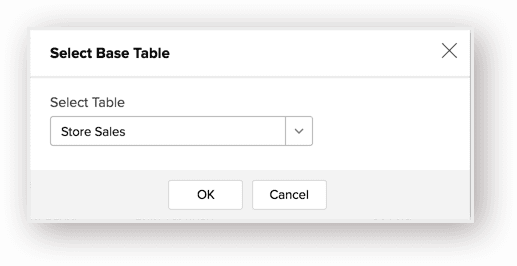
2) In the Select Base Table pop-up dialogue, select the table name you wish to auto-generate reports on and click Ok.
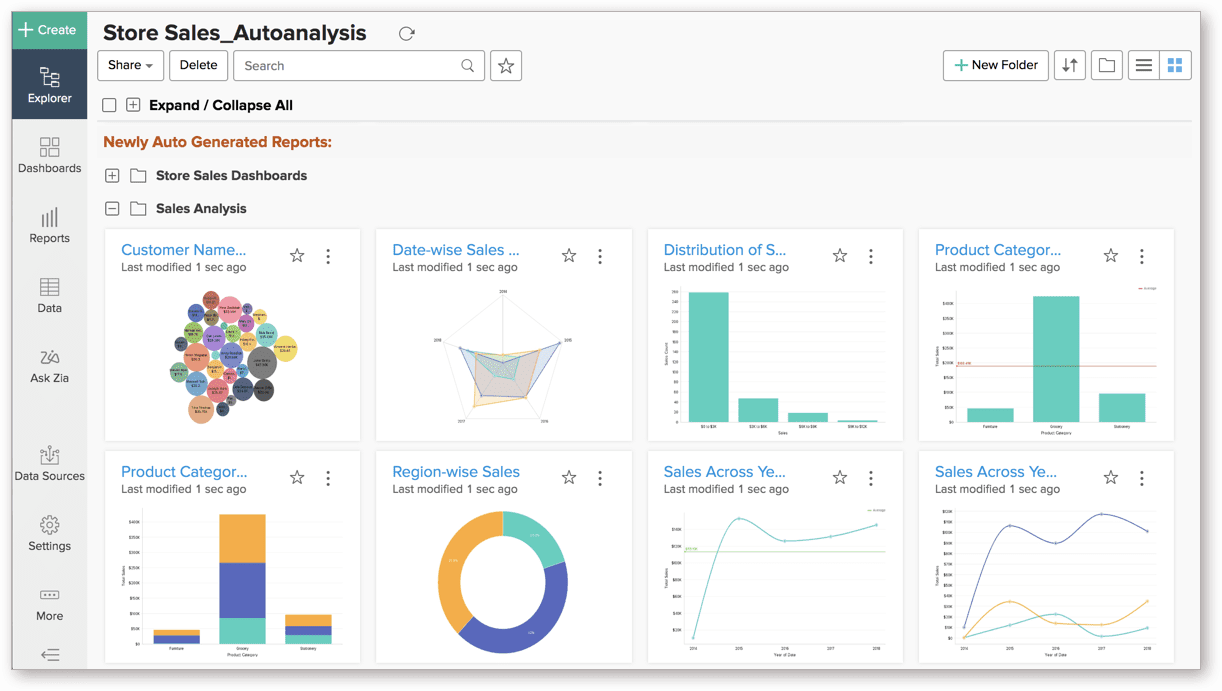
Once you've created your reports and dashboards, a message should pop up that says, 'Reports Successfully Auto Generated' and the most relevant dashboard will be previewed.
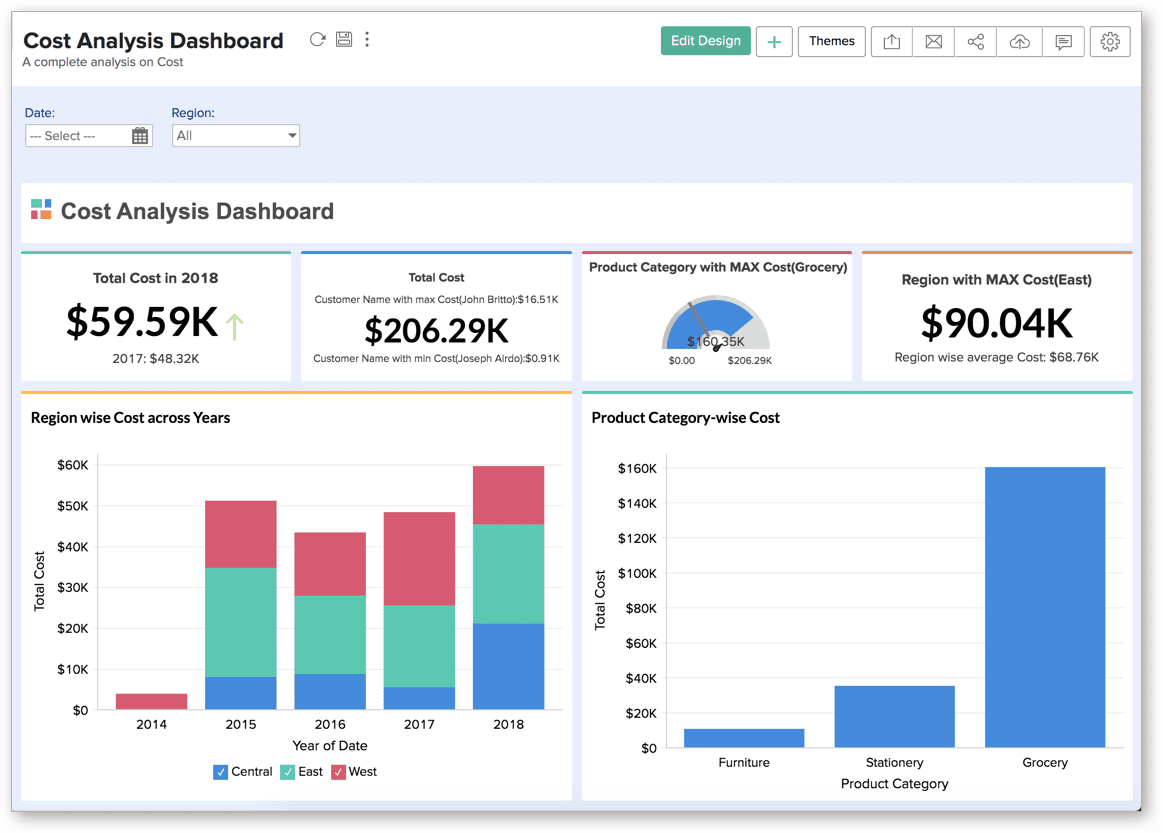
The reports will be organized in a folder called, 'Newly Auto Generated Reports'. You can choose to add more and customize these reports and dashboards.