Zoho Projects can be a powerful tool for helping you to better understand and manage your projects. With the help of this product, it has never been easier to explore and generate meaningful reports and charts. This powerful software provides a range of features that are tailored to your specific project needs. With this application, you can quickly generate insightful and engaging visuals that can help you to effectively track and monitor your projects. Whether you are looking to compare project progress, identify areas for improvement, or get a better understanding of your overall project, Zoho Projects can help you to make the most of your project data.
What is Zoho Projects?
What is Zoho Projects?
Zoho Projects is a powerful project management software that enables you to effectively organize and manage your projects. This web-based software provides you with a range of tools that allow you to easily manage tasks, generate timelines, and collaborate with team members. While Zoho Projects is one of the most powerful project management tools available, it is important to note that this software does not include chart or reporting functionality. This means that if you are looking to create visual representations of your project data, you will need to use another resource like Zoho Analytics. Zoho Projects is particularly useful for large enterprises and businesses that need to manage a large number of projects. The software allows you to create, organize, track and report on all of your projects from one user-friendly interface. Zoho Projects is optimized for all devices, including desktops, laptops, tablets, and smartphones. This means that you can access your projects from any location or device.
Types of Charts in Zoho Projects
Types of Charts in Zoho Projects
When it comes to creating charts in Zoho Projects, there are two main charts available. You can create a Gantt Chart or Resource Utilization Chart.
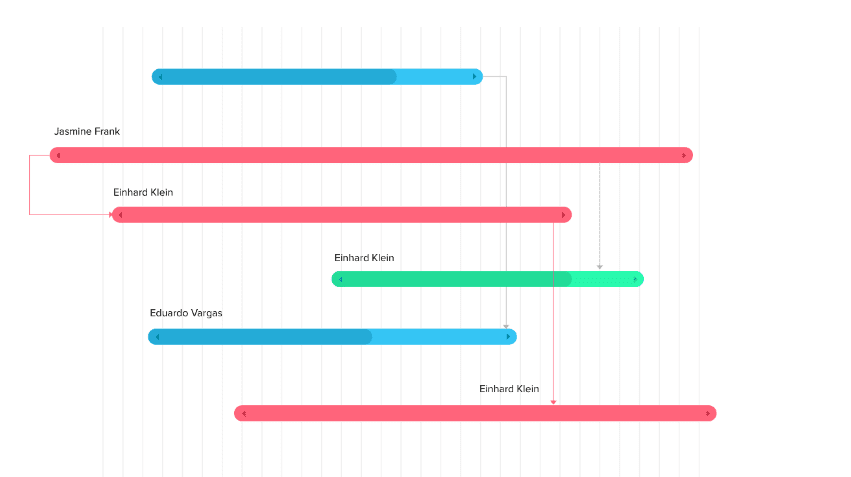
1) Gantt Charts help you plan and track your project better by giving you a visual representation of the current status of the project. This tool is used to plan your project and ensure that you stay on track with your project. With Gantt charts, you are able to create dependencies between related tasks, reschedule tasks easily, and track progress closely.
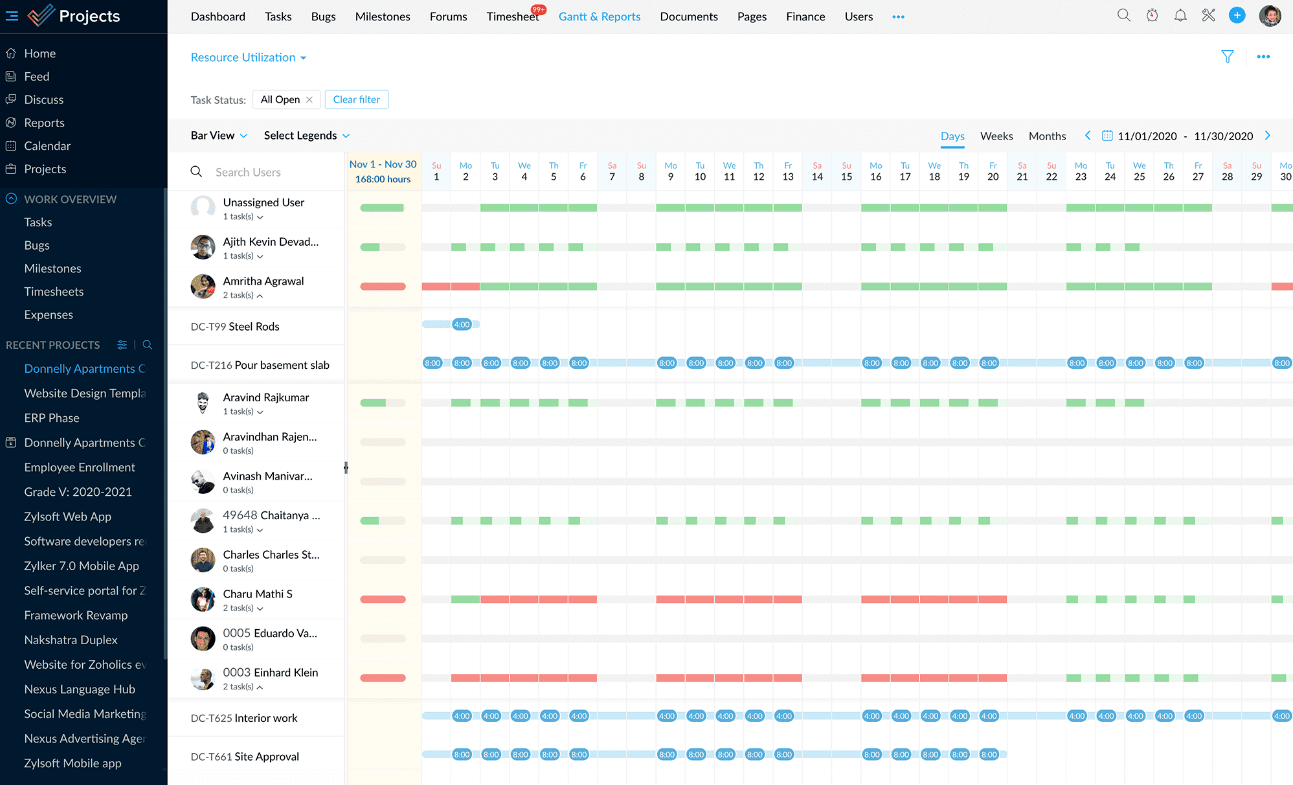
2) The resource utilization chart gives you a balanced view of your team's work hours and free hours. With this, know the availability of all your team member's and allocate work hours effectively to make the most of your time. It helps you make sure that tasks are distributed evenly among your team mates and it gives you an idea of who is free and who is busy.
Reports on Zoho Projects
Reports on Zoho Projects
Once you have created the charts relevant to your projects, you can then explore the available reports. Zoho Projects allows you to explore project-related reports such as the project report, task report, issue report, and time-sheet report. You can explore these reports by clicking on the “Reports” and scrolling through each of the reports. From here, you can select a report that you are interested in viewing. Once you have selected a report, you can click on the “Edit” option to customize the report. This allows you to further customize the report to view it how you would like.
Project Report: Provides an overview and depicts your project's progress, budget health, team performance, overdue tasks, timesheet summary, and more.
Task Report: Get a bird's eye-view of the open and closed tasks in your project based on owner, milestones, and priority in Task Report.
Issue Report: give deep insights on the status of the issues. Issues can be analyzed based on numerous parameters.
Time-Sheet Report: displays time logs across all projects.
How to Use Reports & Charts in Zoho Projects
How to Use Reports & Charts in Zoho Projects
Gantt charts gives you access to a quick overview of your project status. This allows you to track the progress of your project at all times which can be useful for allocating resources optimally. By working with interdependencies, avoid schedule clashes and identify areas where delays and bottlenecks are present. All of these features can allow you to resolve risks and changes in real-time. Resource Utilization charts gives you a quick view of how everyone's schedule is looking, whether they are free or busy. You can use this to organize the tasks on your Gantt chart to make more use of your time and increase productivity.
The project reports can provide basic information on your projects including status, owner, client, etc. Task reports view provide a consolidated view of all the tasks in a project based on their status, milestone, priority, owner, and completion percentage. Issue Reports give deep insights on the status of the issues. The org timesheet report display time logs across all projects. Task reports view provide a consolidated view of all the tasks in a project based on their status, milestone, priority, owner, and completion percentage. Overall, the reports are used to consolidate information on your projects and can determine whether or not the best practices are taking place on your projects.