Robust data interpretation is essential for turning raw data into actionable insights. By focusing on key strategies like understanding context, choosing the right visualization techniques, considering multiple perspectives, and ensuring a single source of truth, you can significantly improve the quality of your analysis.
In the competitive landscape of marketing, robust data interpretation is crucial for agencies striving to stay ahead. Analytics dashboards play a pivotal role in this process, offering a powerful means to interpret and act on data effectively. Here’s how marketing agencies can leverage analytics dashboards to enhance their data interpretation and make smarter decisions.
1. Understand the Context: Laying the Foundation
Why It’s Important:
Understanding the context in which data is collected and analyzed is the foundation of robust data interpretation. Without context, data can easily be misinterpreted, leading to misguided decisions that could harm client campaign.
Every data point tells a story, but to truly understand it, marketing agencies must first grasp the context. Whether it’s a campaign’s performance, audience behavior, or market trends, the context gives data its meaning. For example -
- Campaign Analysis: Before interpreting metrics like click-through rates or conversions, understand the campaign’s goals. Was it aimed at brand awareness, lead generation, or customer retention?
- Historical Data Comparison: Contextualize current data by comparing it with historical trends. This helps in identifying whether a spike or dip is an anomaly or part of a larger pattern.
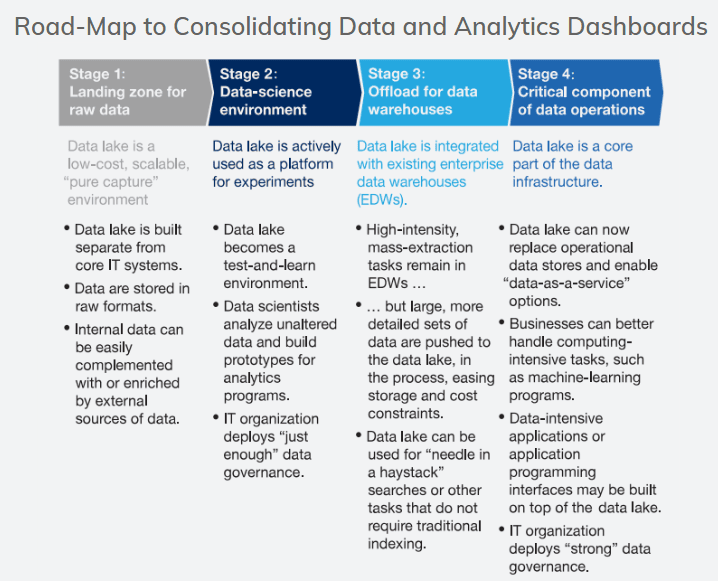
The chart above is from McKinsey's research on data analytics adaption to enhance business and expresses structured approach to data analytics adaption.
Benefits:
- Targeted Campaigns: Aligning data with campaign goals ensures strategies are tailored to specific objectives, improving their effectiveness.
- Enhanced Client Trust: Agencies that demonstrate a deep understanding of the data context build stronger relationships with their clients.
Challenges:
- Contextual Complexity: Data often comes from multiple sources, making it challenging to unify the context.
- Time Constraints: In fast-paced environments, spending time on contextual analysis can be difficult.
Scenarios:
- First Scenario: A client wants to increase brand awareness. Understanding the context of social media engagement metrics helps in designing a campaign that resonates with the target audience.
- Second Scenario: A sudden drop in website traffic. Contextualizing this with seasonal trends or recent marketing changes can provide explanations and guide the response.
This is just one case and an example to establish how analytics help answer questions towards growth, help track operations, provide insights to any specific track-able aspects, clearly point where aspects need attention and what to do about them, among numerous other advantages. Understanding the context ensures that decisions are made with a full awareness of the circumstances, leading to more targeted and effective strategies
2. Use Appropriate Dashboard Visualization Techniques: Crafting the Narrative
Visualization is not just about making data look good—it’s about making it understandable. The right visualization technique transforms raw data into a clear narrative that guides decision-making. Enabling data through analytics dashboards for any such aspects is key to successful use of data. McKinsey conducted a research recently and it stresses on how the process of make data available through analytics dashboards, is a processes that carries many layers and has to be dissected on different levels to achieve comprehensive coverage as well as use of data through analytics dashboards. The following chart from that research by McKinsey reflects at that.
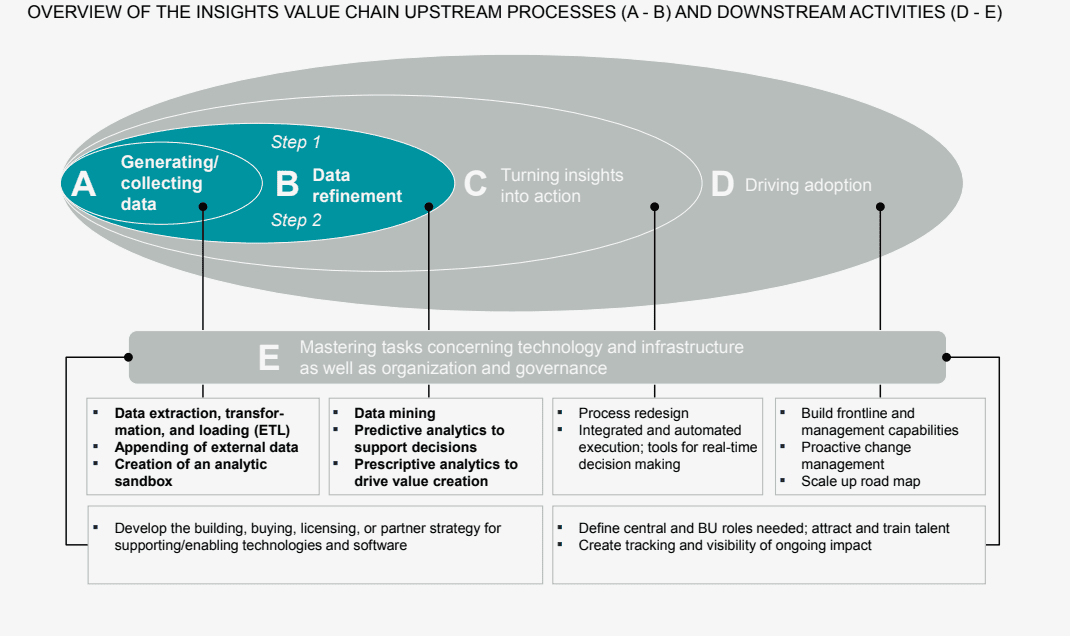
The chart above is from McKinsey's research on data analytics adaption to enhance business and dissects key phases in enabling data analytics across any business organization.
Visualization Strategies:
- Heat Maps for Engagement: Visualize user engagement across different times of the day or week to identify peak activity periods.
- Bubble Charts for Audience Segmentation: Use bubble charts to show audience segments based on criteria like age, location, and purchasing behavior, with the size of each bubble indicating segment importance.
3. Consider Multiple Perspectives: Broadening the View
Robust data interpretation requires looking at data from various angles. Different stakeholders within the agency—whether they’re in marketing, sales, or customer support—bring unique perspectives that can enrich the interpretation process.
Collaboration in Action:
- Cross-Departmental Workshops: Organize sessions where different teams analyze the same data from their perspectives. For instance, while the marketing team might focus on campaign performance, the sales team might be more interested in lead quality.
- Client Feedback Loop: Incorporate feedback from clients to align the interpretation of data with their business goals, ensuring that strategies are not only effective but also client-focused.
Considering multiple perspectives prevents tunnel vision, leading to more comprehensive and well-rounded interpretations that can address various business needs.
4. Dashboards as a Single Source of Truth: Ensuring Consistency
4. Dashboards as a Single Source of Truth: Ensuring Consistency
In marketing agencies, where data can come from various sources, maintaining a single source of truth is essential. An integrated dashboard that consolidates data ensures that everyone in the agency is working with the same information.
Key Components:
- Real-Time Data Integration: Ensure that the dashboard pulls in real-time data from all relevant sources—social media platforms, CRM systems, and ad networks—so that the team always has up-to-date information.
- Customizable Views: Offer team members the ability to customize their dashboard views to focus on the metrics most relevant to their roles, while still drawing from the same core data set.
Impact: A single source of truth eliminates discrepancies, fosters collaboration, and builds trust in the data, ensuring that all teams are aligned in their efforts.
5. Integrated Insights Across Functions: Driving Unified Strategies
Data interpretation should not be confined to silos. By integrating insights across functions—whether it’s marketing, sales, or customer service—agencies can develop more cohesive and effective strategies.
Strategic Integration:
- Unified Reporting: Develop reports that highlight how marketing efforts impact sales and customer satisfaction, providing a holistic view of the agency’s performance.
- Cross-Functional Dashboards: Create dashboards that combine data from different functions, showing how activities in one area influence outcomes in another. For example, correlate marketing campaign performance with customer retention rates.
Integrated insights ensure that all functions within the agency are moving towards the same goals, leading to more synchronized and effective strategies.
Robust Analytics dashboards are an absolute game-changer for Marketing Agencies and the businesses that they take on as clients. Not only does it help Marketing Agencies with client reporting, operations and other client focused aspects but also internally, Marketing Agencies are able to quantify where they lag, where they can perform better and how, where they are exceptionally good and must enhance further - and many other such aspects. A recent research carried out by McKinsey specifically underlines that and the following table from their research reflects at that.
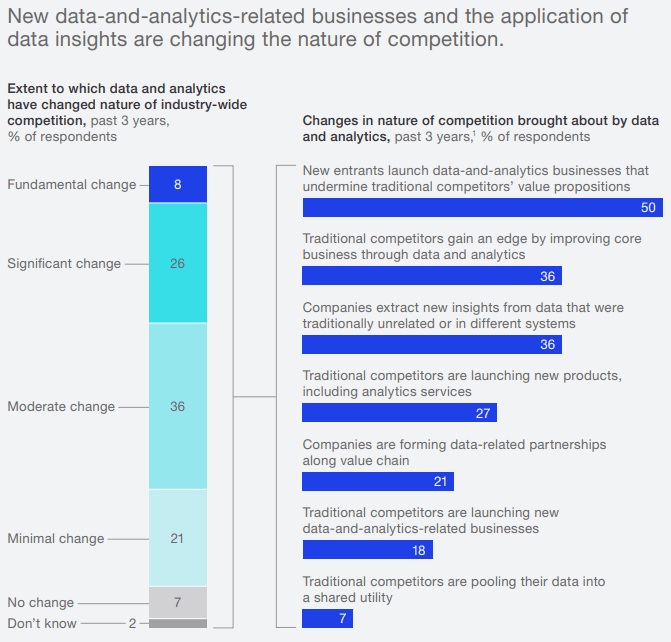
The chart above is from McKinsey's research and emphasizes specifics tied to the usage as well as capability of data in occupying market share in any industry!
Erphub has been enabling businesses across industries with comprehensive digital analytics and dashboard solutions. Our guide, free guide available through the link below, takes managers, business owners and organizations through visibility across key areas of business that benefit out of Single Source of Truth analytics dashboard solutions.


Discover Similar Blog Articles: