
In the digital-first economy, the ability to access, analyze, and act on data in real-time is no longer a competitive advantage—it is a prerequisite for survival. Organizations have amassed vast quantities of operational data, but this information has historically been siloed within individual applications, making a unified, coherent view of the business a near-impossible task. This fragmentation has created a significant "data gap" between strategic vision and operational reality. Zoho One, the comprehensive operating system for business, has long addressed this issue through its deeply integrated suite of applications. However, a recent and transformative update takes this a step further, empowering individual users with the ability to create their own customizable user dashboards. With a library of over 50 widgets from various Zoho One apps, this new functionality marks a paradigm shift, moving the power of analytics from a centralized, IT-driven function to a democratized, user-centric tool for intuitive live analytics and operational control.
This article delves into the strategic implications of this update, adopting the analytical rigor of a top-tier business publication. We will move beyond a simple feature description to explore how these customizable dashboards act as a crucial link between data generation and data-driven decision-making. We will examine the architecture of this new feature, analyze its diverse applications across different business functions—from sales and marketing to finance and human resources—and articulate how this newfound visibility can foster a culture of accountability, agility, and continuous improvement.
Finance and Operations: A Real-time Financial Command Center
For finance and operations teams, the new dashboards transform static financial reports into a dynamic, real-time command center. In the past, financial data was often a historical artifact—a snapshot of the business at the end of a quarter or a month. With customizable dashboards, finance controllers and operations managers can now gain live insights into the financial health and operational efficiency of the organization. A finance controller can create a dashboard with widgets from Zoho Books to monitor key financial metrics such as cash flow, outstanding receivables, and payables. They can add widgets from Zoho Expense to track real-time expenses and widgets from Zoho Analytics to compare current performance against historical trends or budget forecasts. This level of granular, live data allows for more proactive financial management, enabling the controller to identify potential cash flow issues or budget overruns before they become a major problem. Similarly, an operations manager can build a dashboard that includes widgets from Zoho Projects to monitor the progress of key initiatives, widgets from Zoho Inventory to track stock levels and order fulfillment, and widgets from Zoho Desk to monitor customer support ticket volumes and resolution times. This unified view provides a complete picture of operational health, allowing the manager to identify bottlenecks, optimize workflows, and ensure that the business is operating at peak efficiency.
Synergistic Potential of the Widget Ecosystem
The power of the new Zoho One dashboards is not in the individual widgets but in their synergistic potential. The ability to combine widgets from different applications on a single dashboard creates a new layer of business intelligence that was previously inaccessible. This cross-application data blending provides a holistic view that transcends departmental silos. To illustrate this, let's consider the strategic advantages of this new ecosystem.
The Architectural Shift From Centralized Reports to Decentralized Intelligence
The traditional business intelligence (BI) model is often characterized by a top-down approach. Analysts or IT professionals are tasked with building reports and dashboards for leadership, a process that can be slow, resource-intensive, and often fails to address the specific, day-to-day needs of frontline employees. The new Zoho One user dashboards fundamentally challenge this model by decentralizing the creation and consumption of business intelligence. This is not just a cosmetic change; it is a profound architectural shift that empowers every user to become their own analyst.
The core of this innovation is a flexible, widget-based dashboard builder. Instead of a rigid, pre-defined interface, users are now presented with a canvas and a rich library of widgets. These widgets are not generic data visualizations; they are specialized components designed to pull and display live data from a wide array of Zoho One applications. This modular approach allows for the construction of highly tailored dashboards that reflect the unique role and responsibilities of each user. For example, a sales manager's dashboard might be completely different from that of a marketing specialist or a finance controller.
This architectural shift is a critical enabler of what some analysts refer to as a "prosumer" model of data analytics—where the consumer of data is also the producer of their own analytical tools. This shortens the feedback loop between an operational action and its data-driven outcome, allowing for more agile and responsive decision-making. The user is no longer a passive recipient of information but an active participant in the business intelligence process. This is a crucial evolution for organizations that need to move at the speed of the market, where waiting for a quarterly report to make a strategic pivot is simply not an option.
Multi-dimensional Applications with User-Centric Dashboards Across Business Functions
The true value of this update lies in its applicability across the entire organizational spectrum. By providing a diverse set of over 50 widgets, Zoho One ensures that every department and every role can create a dashboard that is immediately relevant and actionable. This multi-dimensional approach to analytics is what truly sets this feature apart. Let's analyze how this plays out in four core business functions.
Sales and Marketing across the Unified Customer Journey
For sales and marketing teams, the new customizable dashboards provide a unified, real-time view of the customer journey, from initial engagement to final conversion. Historically, sales data (from a CRM) and marketing data (from a marketing automation platform) were separate, making it difficult to gauge the true ROI of a campaign or the effectiveness of a sales team's follow-up. The new dashboards serve as a bridge between these two functions, creating a single source of truth.
A sales professional can now build a dashboard that includes widgets from Zoho CRM to track their personal sales pipeline, monitor lead status, and view recent customer communications. They can then add widgets from Zoho Campaigns or Zoho Marketing Automation to see which campaigns a specific lead has engaged with, what content they have downloaded, and their lead score. This holistic view provides a powerful context that was previously absent. It allows the salesperson to engage with a prospect in a more informed and personalized manner, increasing the likelihood of a successful conversion.
Conversely, a marketing manager can create a dashboard that pulls data from Zoho Social to monitor brand sentiment, widgets from Zoho Marketing Automation to track campaign performance and lead generation, and widgets from Zoho CRM to see how many of those leads have converted into actual deals. This end-to-end visibility allows for a more accurate calculation of marketing ROI, enabling the manager to optimize campaigns and allocate resources more effectively.
Finance and Operations: A Real-time Financial Command Center
For finance and operations teams, the new dashboards transform static financial reports into a dynamic, real-time command center. In the past, financial data was often a historical artifact—a snapshot of the business at the end of a quarter or a month. With customizable dashboards, finance controllers and operations managers can now gain live insights into the financial health and operational efficiency of the organization.
A finance controller can create a dashboard with widgets from Zoho Books to monitor key financial metrics such as cash flow, outstanding receivables, and payables. They can add widgets from Zoho Expense to track real-time expenses and widgets from Zoho Analytics to compare current performance against historical trends or budget forecasts. This level of granular, live data allows for more proactive financial management, enabling the controller to identify potential cash flow issues or budget overruns before they become a major problem.
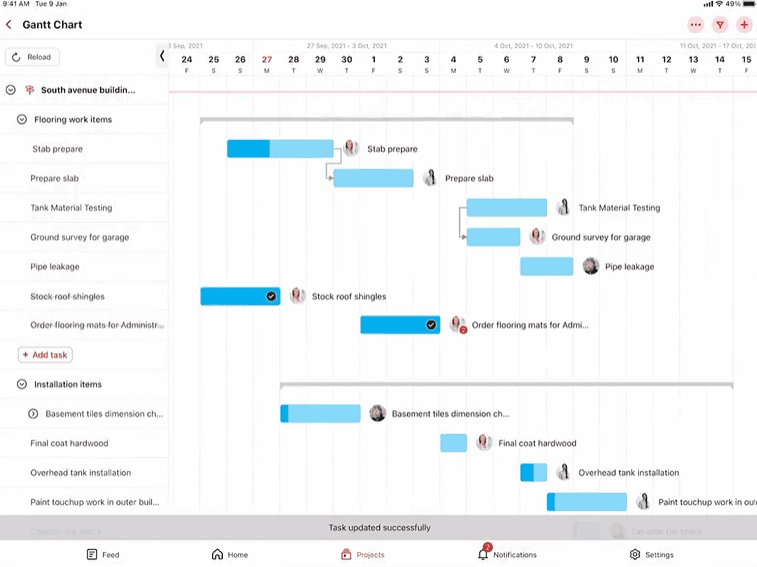
Similarly, an operations manager can build a dashboard that includes widgets from Zoho Projects to monitor the progress of key initiatives, widgets from Zoho Inventory to track stock levels and order fulfillment, and widgets from Zoho Desk to monitor customer support ticket volumes and resolution times. This unified view provides a complete picture of operational health, allowing the manager to identify bottlenecks, optimize workflows, and ensure that the business is operating at peak efficiency.
Analysis of the Widget Ecosystem: The Unlocking of Synergistic Potential
The power of the new Zoho One dashboards is not in the individual widgets but in their synergistic potential. The ability to combine widgets from different applications on a single dashboard creates a new layer of business intelligence that was previously inaccessible. This cross-application data blending provides a holistic view that transcends departmental silos. To illustrate this, let's consider the strategic advantages of this new ecosystem.
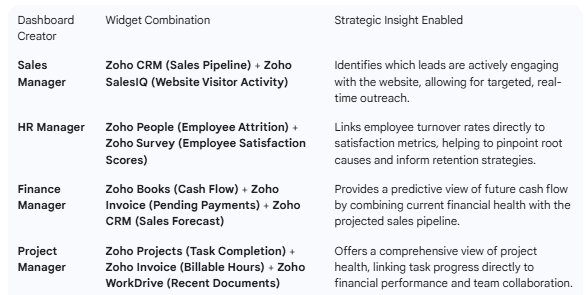

This table provides a glimpse into the strategic insights that are now within the reach of any user. The widgets act as data conduits, pulling information from across the Zoho One suite and presenting it in a coherent, actionable format. This functionality democratizes business intelligence, allowing individuals to make more informed decisions at every level of the organization, without needing to be a data scientist.
The Erphub Advantage: A Strategic Partner for Your Dashboard-Driven Enterprise
The new customizable dashboards in Zoho One are a powerful tool for driving operational excellence, but their true potential can only be realized with a strategic approach to implementation and integration. For organizations looking to leverage this new feature to its fullest, a trusted partner is essential. This is where Erphub provides its unique value.
Our expertise goes beyond simply enabling the new dashboard functionality. We work as a strategic partner to help your organization navigate this new data paradigm. We specialize in:
Workflow Analysis and Design: Before widgets are even selected, we conduct a deep-dive analysis of your business processes. We work with you to understand your key performance indicators (KPIs) and design a dashboard strategy that is aligned with your strategic goals.
Customization and Integration: The power of Zoho One lies in its seamless integration. We help you create and configure custom widgets, integrate data from third-party applications, and build a unified data ecosystem that powers your dashboards.
Training and Adoption: We provide comprehensive training to your team, empowering every user to build and utilize their own dashboards effectively. Our goal is to ensure high user adoption and to embed a data-driven culture throughout your organization.
Continuous Improvement: The new dashboards are not a static solution; they are a tool for continuous improvement. We work with you on an ongoing basis to refine your dashboards, add new widgets, and ensure that your data remains a living, breathing asset that drives your business forward.
The new customizable user dashboards in Zoho One represent a significant leap forward in the world of business intelligence. They move the power of analytics from a centralized, top-down function to a decentralized, user-centric one, empowering every member of your team to access and act on live data. This is more than just a software update; it is a fundamental shift in how business operations can be managed and optimized. With the right strategy and a trusted partner like Erphub, your organization can fully harness this potential, transforming data from a mere collection of numbers into a strategic engine for growth, agility, and competitive advantage.