

Data Extraction-Transformation-Loading (ETL) Processes
The ability to transform raw data into actionable insights is a defining capability of modern businesses. At the heart of this transformation lies the ETL (Extract, Transform, Load) process, a crucial methodology that allows organizations to collect data from multiple sources, clean and structure it, and then store it in a centralized repository for analysis. Without a streamlined ETL process, businesses risk working with fragmented, inconsistent, and outdated data that can misguide strategic decision-making.
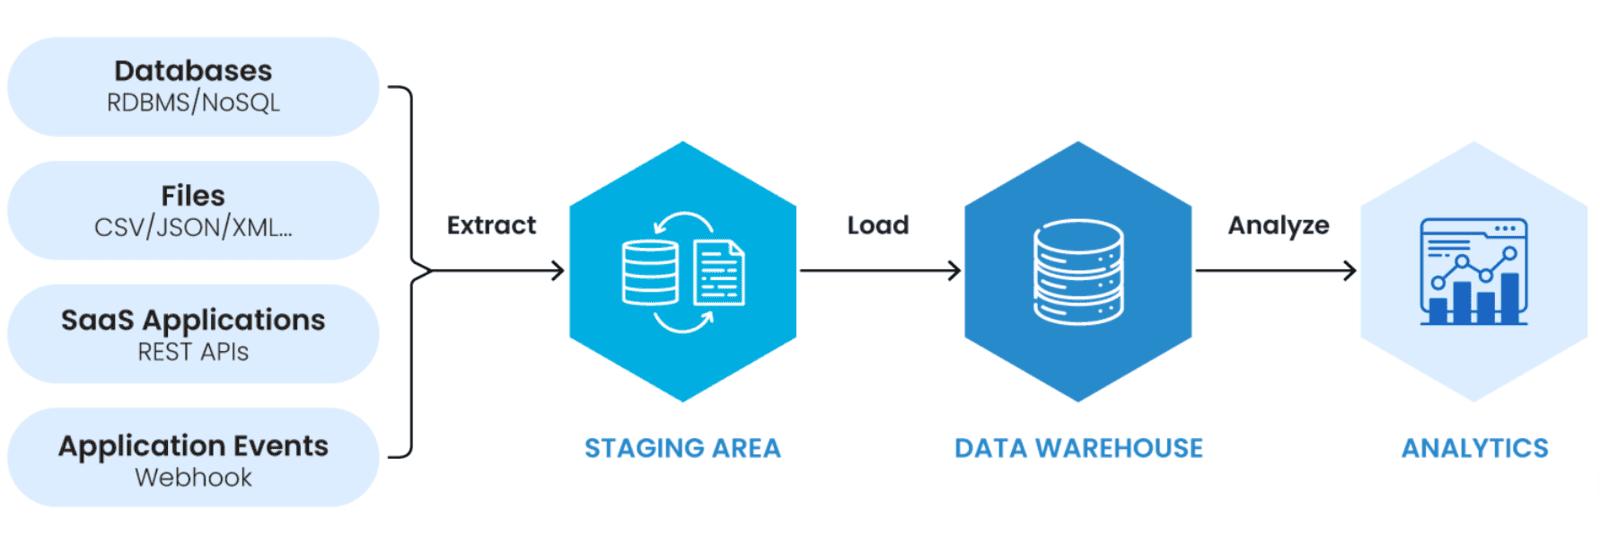
ETL is particularly relevant in an era where companies rely on various digital solutions such as Zoho Analytics to orchestrate seamless data integration. Extraction involves gathering data from diverse sources, including CRM systems, marketing platforms, financial databases, and operational tools. The transformation phase ensures that this data is standardized, formatted correctly, and enriched to enhance its usability. Finally, loading moves the cleaned and structured data into a centralized location—often a cloud-based data warehouse—where it becomes accessible for visualization and decision-making.
Incorporating advanced ETL solutions such as those provided by Zoho Analytics helps organizations automate the process, reducing manual intervention and enhancing data accuracy. By leveraging automated workflows and AI-driven cleansing mechanisms, businesses can ensure that their data pipeline remains efficient, reducing latency and improving the quality of insights derived from it.
Connected Visualization to Data Points
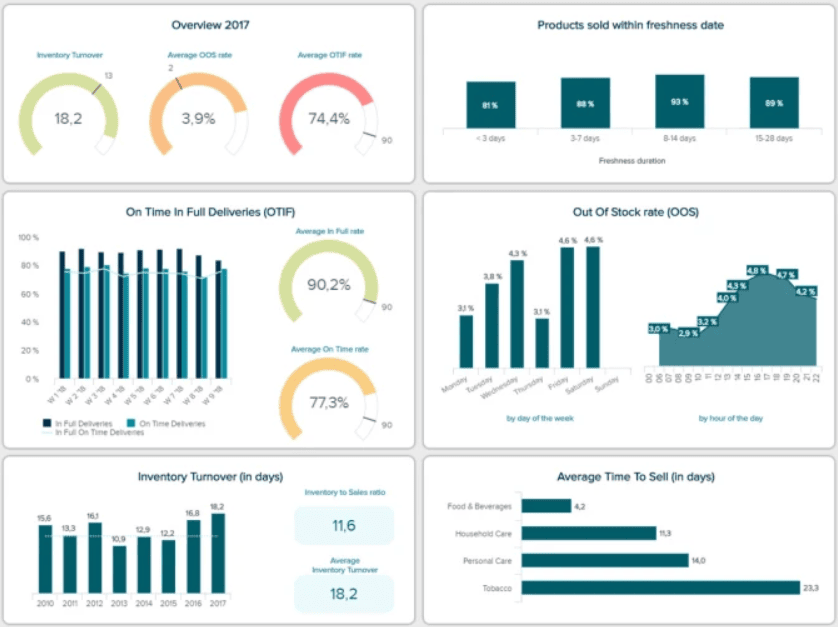
Once data has been effectively extracted, transformed, and loaded, the next critical step is visualization. Data visualization is not merely about presenting numbers in charts and graphs; it is about revealing patterns, trends, and correlations that would otherwise go unnoticed. Businesses that rely on robust data visualization solutions can unlock significant competitive advantages by making informed decisions faster and more accurately.
A well-connected visualization strategy ensures that data points from various sources are linked in a meaningful way, creating a holistic view of business performance. Zoho Analytics offers powerful visualization tools that allow businesses to create dynamic dashboards, offering real-time insights into key performance indicators (KPIs). With the right visualization techniques, organizations can go beyond surface-level data analysis and drill down into specifics, such as identifying which marketing campaigns are driving the highest ROI or which customer segments are most profitable.
Insights Based on Contextual Frameworks from Data Flow
The power of contextual insights also extends to operational efficiency. Businesses engaged in logistics and supply chain management can leverage Zoho’s analytics solutions to monitor delivery times, inventory levels, and supplier performance. By continuously analyzing this data through a contextual framework, companies can make incremental improvements to optimize costs, reduce delays, and enhance customer satisfaction.
For continuous improvement cycles, organizations need to create feedback loops where insights inform future strategies. This is a foundational principle of modern business intelligence—using data to iterate and refine business operations in real time. When businesses implement a structured approach to insight generation, they can achieve ongoing optimization across all functions, from marketing and sales to finance and customer service.
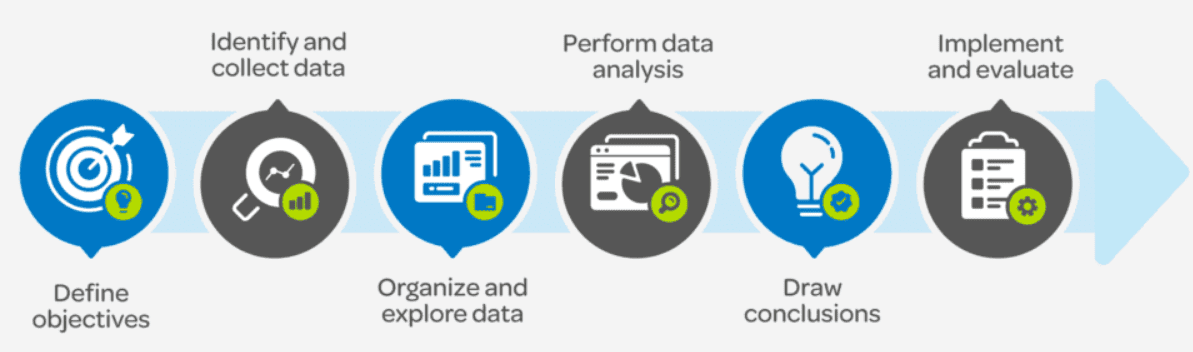
Merely visualizing data is not enough; businesses need structured methodologies to derive meaningful insights that lead to actionable improvements. This is where contextual frameworks come into play. A contextual framework ensures that data analysis is not conducted in isolation but within the broader perspective of business goals, market dynamics, and operational workflows.
Zoho Analytics enables businesses to implement contextual frameworks that allow insights to be extracted based on data flows. These insights are dynamic, evolving as new data enters the system. For instance, an e-commerce business tracking customer behavior may notice seasonal trends in purchasing patterns. By integrating this knowledge with marketing automation tools, the business can optimize its promotional strategies to align with peak shopping periods, thereby maximizing revenue potential.

By implementing these three factors—ETL processes, connected visualization, and contextual insights—businesses can transform raw data into valuable intelligence that drives success. Zoho Analytics, with its comprehensive suite of digital solutions, serves as a powerful enabler of this transformation, ensuring that companies can move from data to insights seamlessly and effectively.