The "first screen," also widely known as "above the fold," refers to the portion of a webpage that is immediately visible to a user without requiring any scrolling. Its content, design, and performance are the very first elements a visitor encounters, shaping their initial perception and influencing their subsequent actions. The precise dimensions of the first screen can vary depending on the user's device (desktop, tablet, mobile) and screen resolution, making responsive design crucial.
A "fall-off" in this context signifies a user abandoning the website or application after viewing only this initial segment. This is often measured by a high bounce rate – the percentage of visitors who navigate away from the site after viewing only one page. However, it extends beyond simple bounce rate to encompass instances where a user might stay for a few seconds but exhibit no meaningful engagement (e.g., clicking, scrolling, form interaction) before leaving. It's an indicator of a failed initial engagement, where the presented information or experience did not resonate enough to compel further exploration.
The Criticality of the Initial Impression
The human brain processes visual information incredibly quickly, forming judgments in milliseconds. This rapid assessment holds true for digital interfaces. Research consistently shows that users form an opinion about a website's credibility and appeal within a blink of an eye. This initial impression is not merely superficial; it directly impacts user trust, perceived value, and willingness to engage.
For businesses, the first screen is their digital storefront, their virtual handshake. If this initial interaction is jarring, unclear, slow, or irrelevant, the user is likely to "bounce" back to the search results or move to a competitor's site. This emphasizes the immense psychological and practical weight carried by the first few seconds of a user's visit.
The Impact on Business Objectives
The ramifications of significant first screen user fall-offs are far-reaching and directly impact a business's core objectives.
Wasted Marketing Spend: Every visitor acquired through advertising (PPC, social media ads) or SEO efforts represents an investment. If a substantial portion of these visitors abandon the site immediately, the marketing budget is effectively being spent on non-converting traffic.
Reduced Conversion Rates: Whether the goal is lead generation, sales, subscriptions, or downloads, a high fall-off rate on the first screen directly translates to lower overall conversion rates. Users who don't engage beyond the initial view cannot progress through the conversion funnel.
Negative Brand Perception: A frustrating or unengaging first experience can leave a lasting negative impression of the brand. This can deter future visits and lead to poor word-of-mouth.
Inaccurate Data and Insights: High fall-off rates can skew analytics data, making it challenging to accurately understand user behavior deeper within the site. This can lead to misinformed optimization efforts.
Lower Search Engine Rankings (Indirectly): While bounce rate itself isn't a direct ranking factor, prolonged high bounce rates can signal to search engines that a page isn't satisfying user intent, potentially impacting long-term SEO performance. Google prioritizes user experience, and a site that consistently fails to engage visitors from the outset may see its rankings decline over time.
Understanding these foundational aspects of first screen user fall-offs is the first step towards developing a robust strategy for optimization, ensuring that every visitor has the best possible chance of becoming a valuable customer.
Understanding the Root Causes of First Screen Fall-Offs
To effectively address and mitigate first screen user fall-offs, it is crucial to delve into the underlying reasons behind this common digital challenge. These causes are often multifaceted, encompassing technical, design, content, and strategic elements, each contributing to a user's decision to abandon a session prematurely.
Page Load Speed and Performance
Perhaps the most immediate and unforgiving cause of first screen fall-offs is slow page load speed. In an age of instant gratification, users have minimal patience for websites that take more than a few seconds to load. Studies by Google and other research firms consistently show a direct correlation between page load time and bounce rates.

Despite its undeniable importance, accurately measuring and effectively optimizing CLV presents significant challenges for many businesses. These hurdles often stem from a combination of technological limitations, organizational silos, and a lack of unified strategy:
Fragmented Data and Information Silos: One of the most pervasive challenges is the fragmentation of customer data across disparate systems. Customer relationship management (CRM) systems may hold sales interactions, marketing automation platforms may track engagement, while accounting and payment systems manage transactional history. This segregation creates an incomplete and often inconsistent view of the customer, making it arduous to construct a holistic CLV profile. Without a unified data source, it becomes difficult to correlate marketing spend with purchase behavior, or support interactions with retention rates.
Lack of a Unified Customer View (Single Source of Truth): Stemming from data silos, the absence of a "single source of truth" for customer information severely hampers CLV optimization. Different departments may have conflicting or incomplete customer records, leading to disjointed customer experiences, inefficient communication, and missed opportunities for personalization. A customer service representative, for instance, might not have access to a customer's payment history or recent marketing interactions, leading to a sub-optimal support experience.
Difficulty in Attributing Value Across Touchpoints: In today's multi-channel customer journey, customers interact with a business through numerous touchpoints—website visits, social media, email campaigns, direct sales calls, support tickets, and payment portals. Accurately attributing which specific interactions contribute to long-term customer value and subsequent purchases is complex. This attribution challenge complicates efforts to identify the most effective strategies for CLV enhancement and allocate resources efficiently.
Manual Processes and Operational Inefficiencies: Many businesses still rely on manual data entry, spreadsheet-based tracking, and disconnected processes for managing customer interactions and financial transactions. This not only introduces human error and delays but also consumes valuable time that could be spent on strategic analysis and customer engagement. Inefficient billing, slow payment processing, or cumbersome subscription management can directly erode customer satisfaction and, consequently, CLV.
Absence of Predictive Analytics and Proactive Insights: While historical CLV is informative, optimizing for future value requires predictive capabilities. Many organizations lack the tools or expertise to analyze historical data, identify patterns, and forecast future customer behavior. This leaves them in a reactive mode, addressing issues only after they arise, rather than proactively engaging customers, preventing churn, or identifying high-value upsell opportunities.
Organizational Alignment and Skill Gaps: Even with the right tools, a successful CLV strategy requires cross-departmental alignment and a shared understanding of its importance. Sales, marketing, finance, and customer service teams must collaborate effectively, sharing data and insights. Furthermore, there can be skill gaps in data analysis, system integration, and leveraging advanced software features to their full potential.

A page that struggles to load its critical "above the fold" content within the first few seconds will almost certainly lose a significant portion of its audience. This includes the initial rendering of text, images, and interactive elements. Factors contributing to slow load times include:
Large Image Files: Unoptimized images are a frequent culprit, consuming significant bandwidth.
Unminified CSS and JavaScript: Bloated or uncompressed code can delay rendering.
Excessive HTTP Requests: Too many calls to the server for various resources can slow down the initial display.
Poor Server Response Time: The time it takes for a server to respond to a browser request.
Lack of Caching: Inefficient caching mechanisms can force browsers to re-download assets unnecessarily.
Poor User Experience (UX) and Design
The aesthetics and usability of the first screen profoundly influence user perception. A visually unappealing or difficult-to-navigate interface can quickly deter visitors.
Common UX and design flaws on the first screen that lead to fall-offs:
Cluttered Layout: Too many elements competing for attention, leading to cognitive overload.
Inconsistent Branding: A disconnect between the ad or referring source and the website's visual identity.
Poor Visual Hierarchy: The most important elements are not visually emphasized, making it hard for users to quickly scan and understand.
Dysfunctional or Hidden Navigation: Users struggle to find menus or links, leading to frustration.
Unprofessional Appearance: Outdated design, low-quality imagery, or typos can erode trust.
Lack of Mobile Responsiveness
With the increasing dominance of mobile Browse, a website that does not render correctly or function optimally on smartphones and tablets is a major cause of first screen fall-offs. Users encountering a desktop-optimized site on their mobile device will face issues with readability, navigation, and usability, almost certainly leading to immediate abandonment.
Specific mobile responsiveness issues include:
Non-Responsive Design: Content that doesn't adapt to different screen sizes, requiring excessive pinching and zooming.
Tiny Tap Targets: Buttons or links that are too small or too close together for easy mobile interaction.
Horizontal Scrolling: Content extending beyond the mobile viewport, forcing inconvenient horizontal scrolling.
Heavy Mobile Assets: Large images or scripts that are not optimized for mobile network speeds.
Information Overload and Cognitive Friction
While providing information is crucial, overwhelming users with too much data or too many choices on the first screen can lead to "analysis paralysis" or cognitive friction. This happens when the effort required to understand or interact with the page outweighs the perceived benefit.
Indicators of information overload:
Excessive Text Blocks: Long paragraphs that are difficult to scan.
Too Many CTAs: Presenting multiple, conflicting calls to action.
Complex Forms: Asking for too much information upfront without clear justification.
Confusing Navigation: Overly complex menu structures or too many options.
Misalignment with User Intent
Users land on a website with a specific goal or question in mind. If the first screen fails to immediately address that intent, it creates a disconnect that often results in a fall-off. This is particularly relevant for traffic arriving from search engines or specific marketing campaigns.
Examples of misalignment:
Keyword Stuffing without Relevance: A page ranking for a keyword but the initial content isn't relevant to the user's query.
Misleading Ad Copy: The content of an advertisement promises one thing, but the landing page delivers another.
Generic Content: A homepage that tries to be everything to everyone, failing to address specific user needs.
By understanding these common culprits, businesses can begin to strategically analyze their own website's first screen performance and develop targeted solutions. The next step is to leverage powerful analytics tools to accurately diagnose these issues.
The Role of Zoho PageSense in Diagnosing Fall-Offs
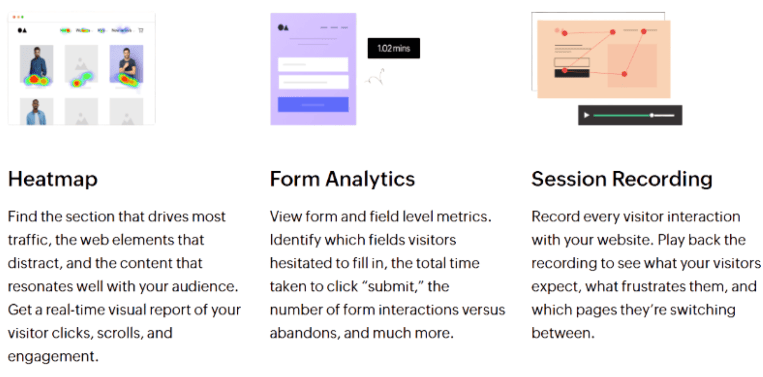
Effective optimization begins with a deep understanding of user behavior. Zoho PageSense, a powerful conversion rate optimization (CRO) and web analytics tool, provides the crucial insights needed to pinpoint exactly why users are falling off on the first screen. Its suite of features offers both quantitative and qualitative data, painting a comprehensive picture of user interactions. Zoho PageSense's heatmap functionality provides a powerful visual representation of user behavior on a webpage. These color-coded overlays reveal where users click, where they move their mouse (for desktop), and how far they scroll.
Click Maps: Show areas where users click. Hotter spots (red, orange) indicate frequent clicks, while colder spots (blue, green) show less interaction. For the first screen, this can highlight if users are clicking on expected CTAs or if they are repeatedly clicking on non-interactive elements (indicating frustration or confusion). If critical elements are not receiving clicks, their placement or design may need adjustment.
Scroll Maps: Illustrate how far down a page users scroll. If a scroll map shows a rapid decline in engagement below the fold, it suggests that the first screen is failing to provide enough incentive for users to explore further. This can point to an unclear value proposition, uninteresting visual content, or a lack of strong visual cues to scroll.
Attention Maps: (If available in PageSense, or conceptual equivalent) Show areas where users spend the most time looking. This can confirm if the primary message or CTA is indeed capturing attention.
By analyzing heatmaps on the first screen, businesses can answer crucial questions like:
Are users seeing our main call-to-action?
Are they clicking on anything unexpected?
Is our most important content being completely missed because users aren't scrolling?
Session Recordings: Reliving the User Journey
Session recordings, also known as session replays, allow you to watch anonymized video recordings of actual user interactions on your website. This qualitative data is invaluable for understanding the why behind the numbers. For first screen fall-offs, session recordings are particularly insightful as they capture the initial moments of a user's visit.
Through session recordings, businesses can observe:
Immediate Departures: Watch how quickly users leave the page.
Frustrated Interactions: Identify "rage clicks" (repeated clicks on the same spot, often non-interactive), rapid scrolling, or erratic mouse movements indicating confusion or annoyance.
Navigation Issues: See if users are struggling to find menus, buttons, or information.
Broken Elements: Spot if certain elements aren't loading correctly or if forms are malfunctioning.
Misinterpretation of Content: Observe if users seem to be searching for something not immediately apparent on the first screen.
This direct observation provides context that quantitative data alone cannot. It helps in developing empathy for the user and uncovers friction points that might otherwise go unnoticed.

Zoho PageSense functions as a central hub for various analytics tools, allowing businesses to track, measure, and analyze visitor behavior on their websites. This granular data is instrumental in identifying patterns and anomalies that contribute to first screen fall-offs.
Key metrics and reports within PageSense that inform first screen analysis include:
Bounce Rate: While a high bounce rate isn't always negative (e.g., if a user finds exactly what they need quickly), an unusually high bounce rate specifically on landing pages or the first screen often signals an issue. PageSense allows segmenting bounce rates by traffic source, device, and other parameters to narrow down the problem areas.
Exit Rate: Indicates the percentage of visits that ended on a specific page. If the first page viewed has a high exit rate, it's a clear red flag.
Time on Page (First Page): A very short time on the first page, coupled with a high bounce rate, strongly suggests immediate disengagement.
Page Views per Session: A low number (e.g., 1) indicates that users are not exploring beyond the initial page.
Entry Pages Report: Helps identify which landing pages are experiencing the highest fall-off rates, allowing for targeted optimization efforts.
Zoho PageSense's funnel analysis feature allows businesses to define a sequence of pages or actions that a user is expected to take on their journey towards a conversion goal (e.g., Homepage > Product Page > Cart > Checkout > Confirmation). By mapping this journey, businesses can identify specific stages where a significant number of users are dropping off. For first screen optimization, funnel analysis is critical for:
Entry Page Drop-offs: If the first step of a funnel is the landing page, a high drop-off percentage immediately highlights a first screen issue.
Understanding User Paths: It reveals if users are even attempting to move beyond the initial page into the intended conversion path.
Quantifying the Loss: Provides clear data on the financial or objective loss associated with early exits.
Many websites utilize forms on their first screen or directly accessible from it (e.g., lead capture forms, newsletter sign-ups). Zoho PageSense's form analytics feature provides detailed insights into how users interact with these forms. It can show:
Field-Level Drop-offs: Which specific form fields cause users to abandon the form.
Time to Complete: How long users spend on each field.
Refill Behavior: How often users go back to re-enter information.
If a form is present on the first screen or immediately accessible, high abandonment rates can directly contribute to first screen fall-offs. Analyzing these metrics helps simplify forms, improve instructions, and reduce friction, thereby increasing the likelihood of initial engagement and conversion. By combining the power of these diverse analytical tools within Zoho PageSense, Erphub's clients can move beyond mere assumptions and gain a data-driven understanding of why their first screen might be failing to engage users. This diagnostic phase is the indispensable precursor to any effective optimization strategy.
Once the root causes of first screen fall-offs are diagnosed using Zoho PageSense, businesses can implement targeted strategies to enhance user engagement and improve overall session quality. These strategies encompass technical improvements, design refinements, content optimization, and personalized experiences, all aimed at creating a compelling initial impression. This systematic approach ensures that first screen optimization is not a one-off project but a core, ongoing activity that continuously enhances user experience and drives business growth. Erphub's role here is to guide clients through this entire process, ensuring they maximize the value from their Zoho PageSense investment. While Zoho PageSense offers a robust set of tools, maximizing its potential for optimizing first screen user fall-offs and enhancing user sessions requires strategic expertise and meticulous implementation. Erphub stands as a trusted partner, offering comprehensive services that go beyond mere software setup to deliver tangible business outcomes for its clients.

