
Silicon Valley, a hub of technological innovation, is renowned for its data-driven culture. Companies in the region heavily rely on analytics dashboards to make informed decisions and drive growth. Here are some common analytics dashboards used in Silicon Valley:
Core Dashboards
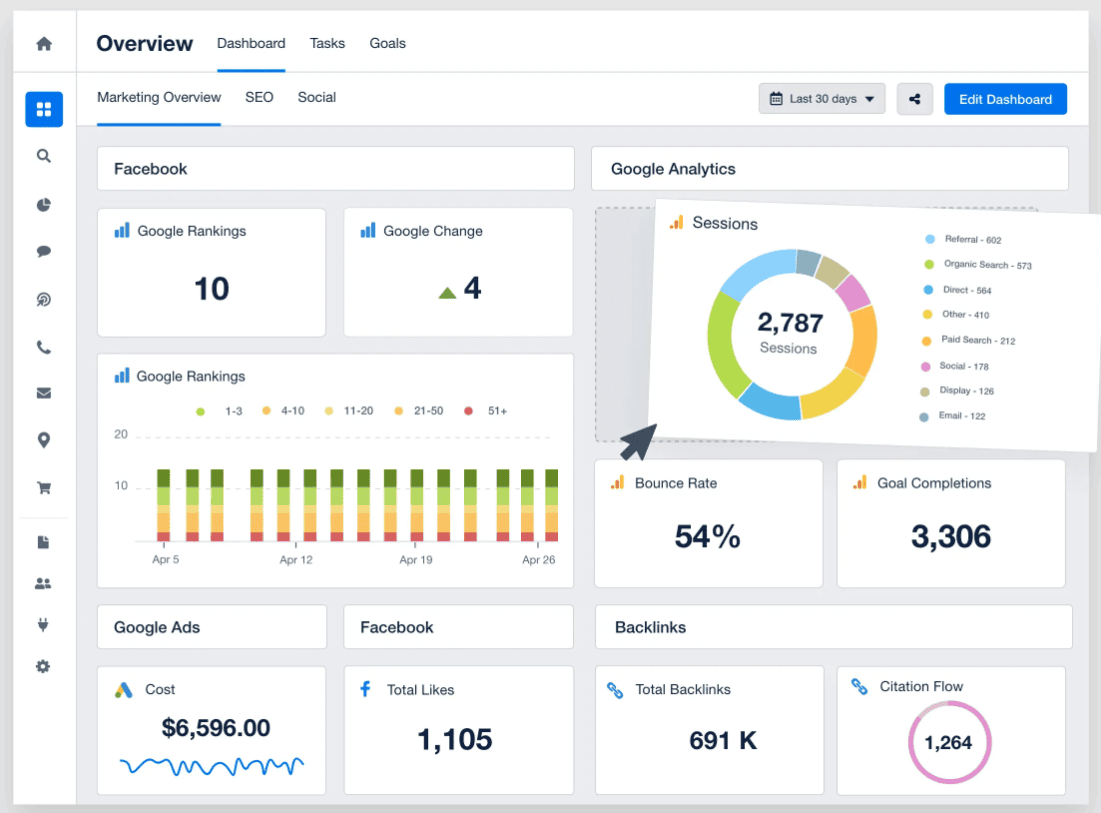
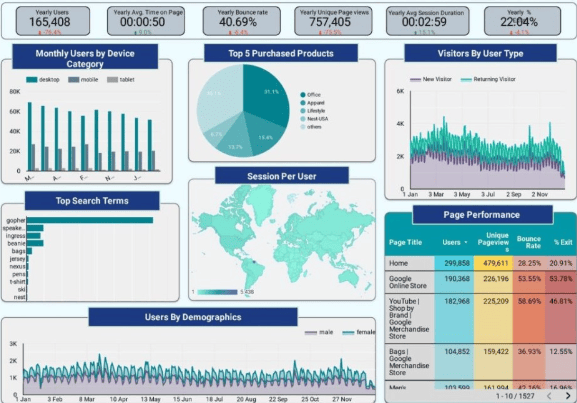
- Marketing Dashboards: Track website traffic, social media engagement, lead generation, conversion rates, customer acquisition cost (CAC), and return on investment (ROI) for marketing campaigns.
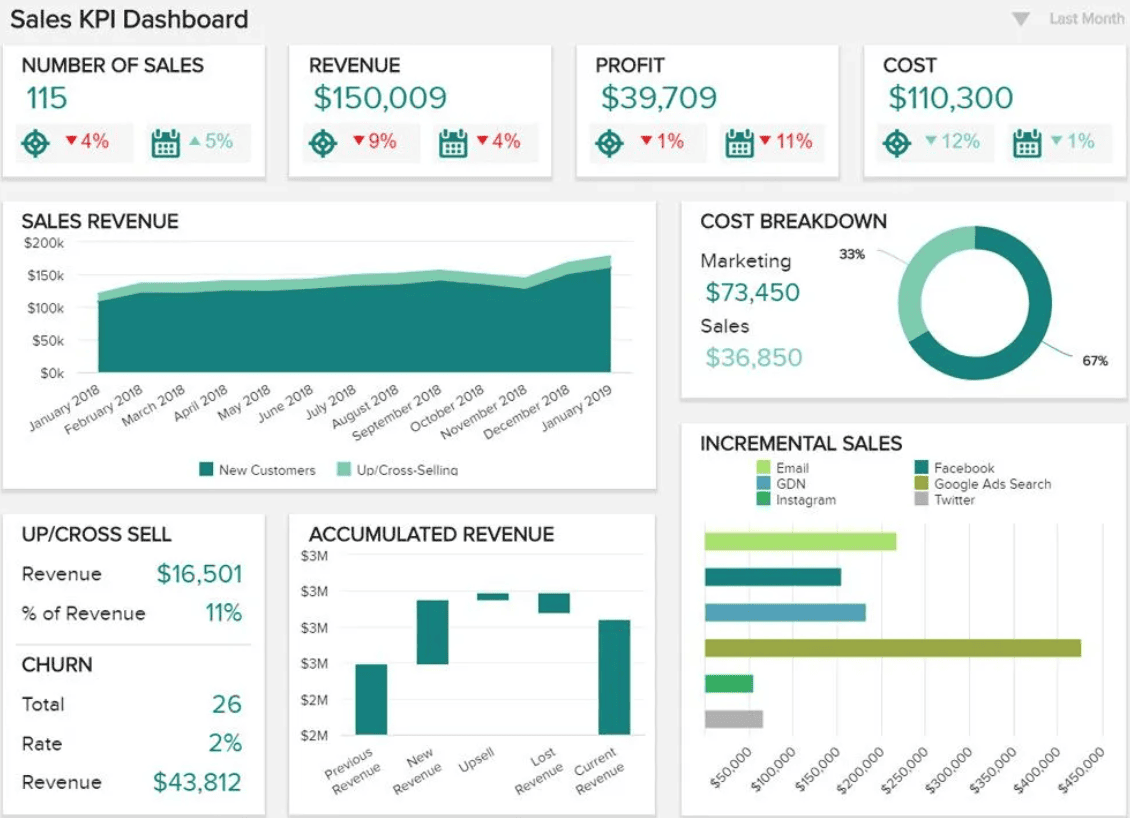
- Sales Dashboards: Monitor sales pipeline, deal closure rates, average deal size, sales cycle length, and sales representative performance.
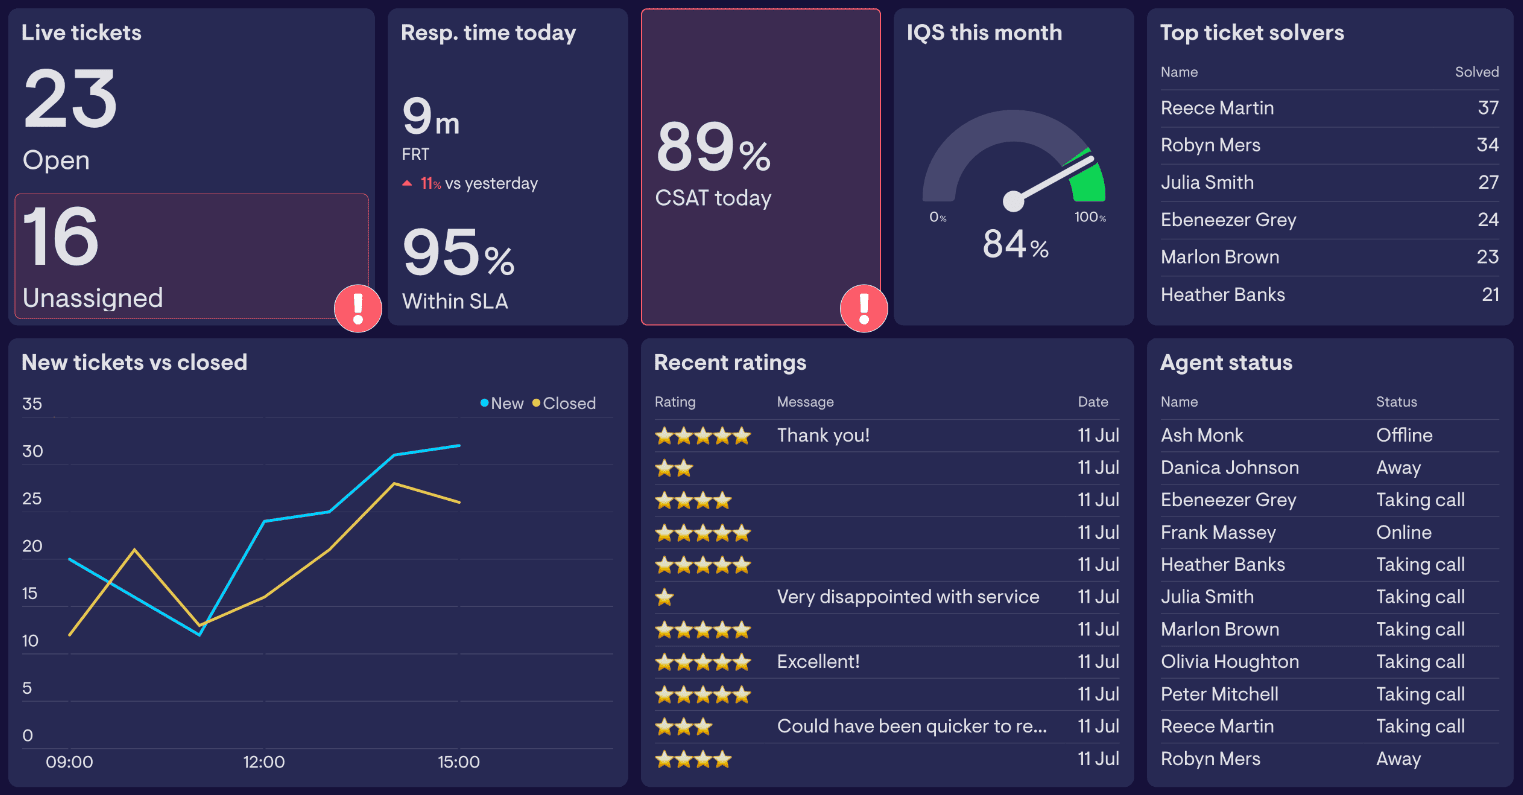
- Customer Support Dashboards: Track customer support ticket volume, resolution time, customer satisfaction (CSAT) and net promoter score (NPS).
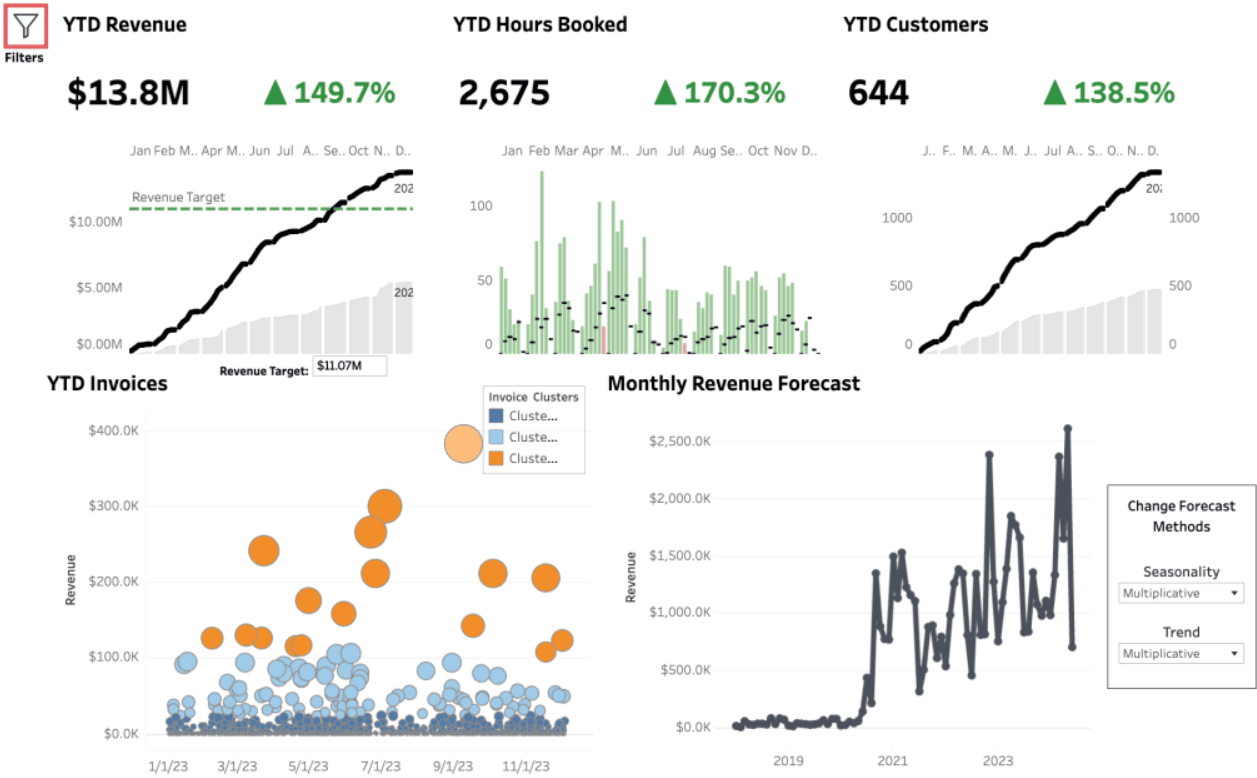
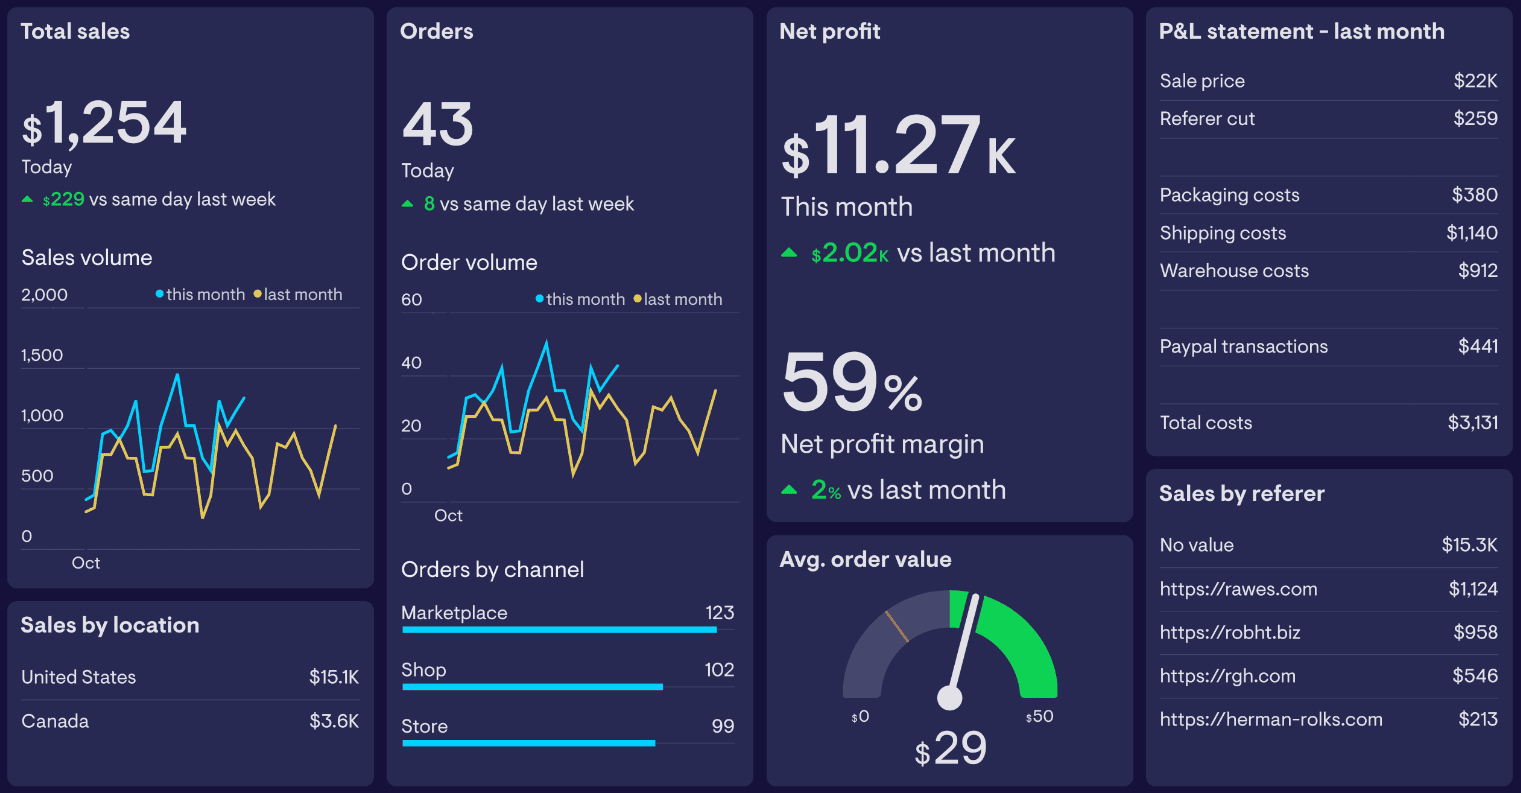
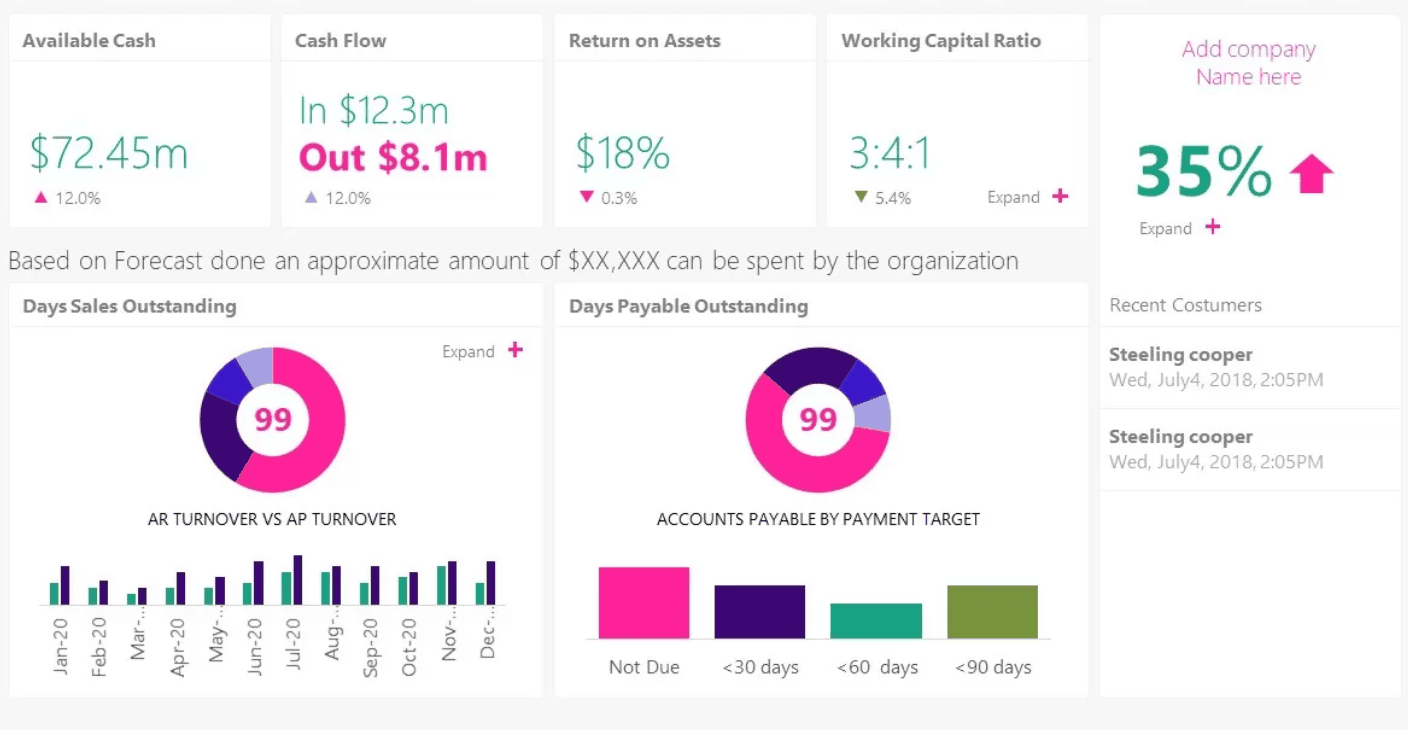
- Financial Dashboards: Monitor revenue, expenses, profit margins, cash flow, and key financial ratios.
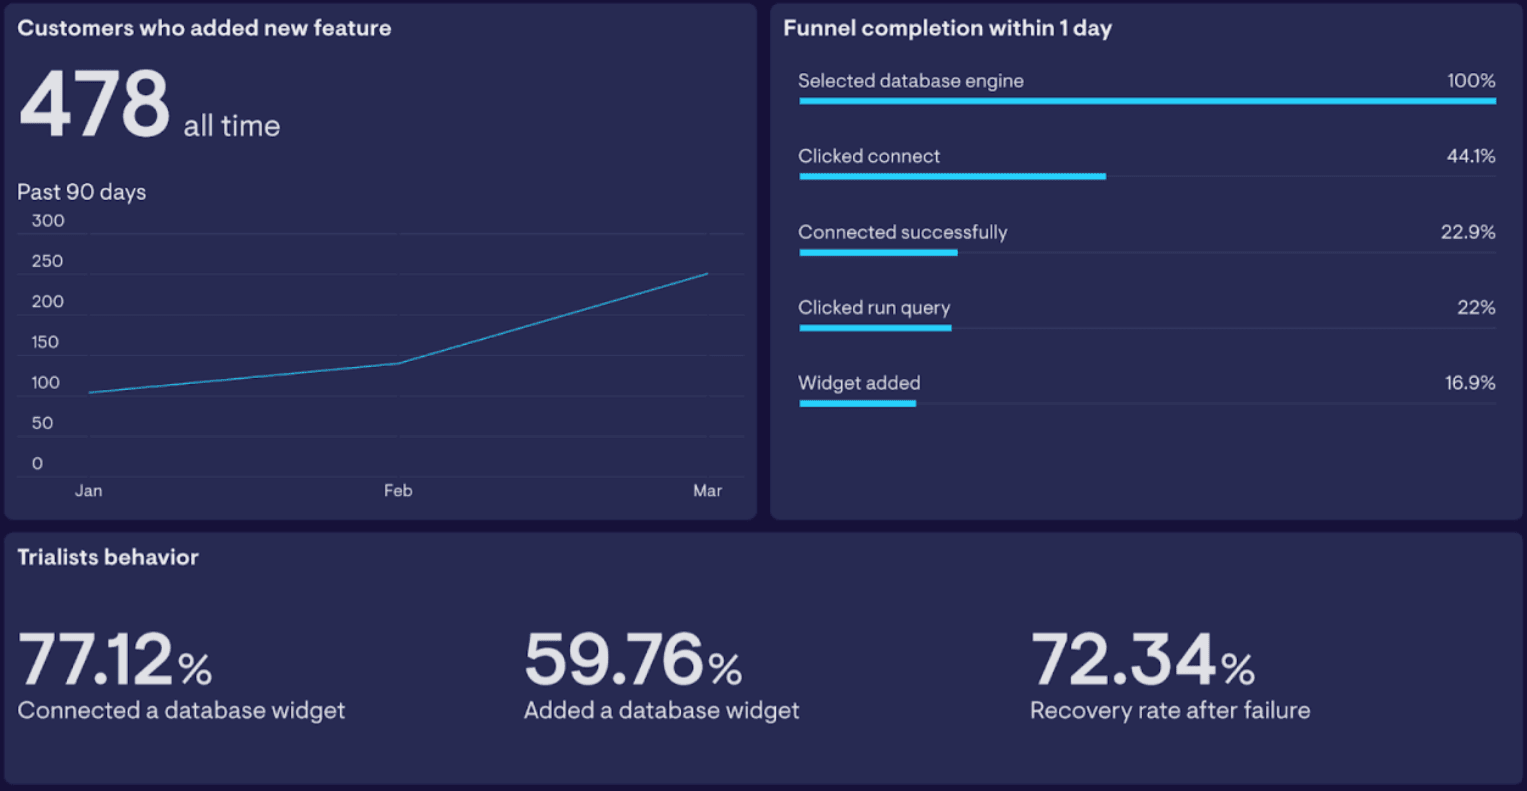
- Product Dashboards: Track product performance metrics, such as user adoption, engagement, and feature usage.
Advanced Dashboards (Frequently Used in Tech Companies)
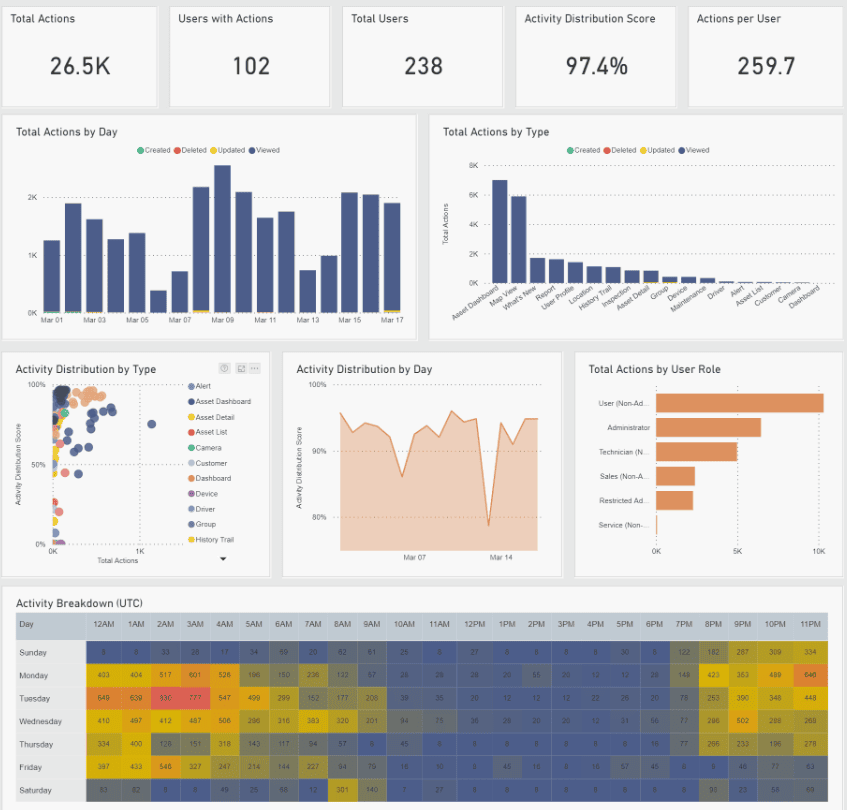
- User Behavior Dashboards: Analyze user interactions with products or services, including clickstreams, session length, and conversion funnels.
- A/B Testing Dashboards: Track the performance of different website or app variations to optimize user experience and conversion rates.
- Predictive Analytics Dashboards: Utilize data to forecast future trends, customer behavior, and business outcomes.
- Customer Lifetime Value (CLTV) Dashboards: Evaluate the long-term value of customers and identify high-value segments.
- Churn Dashboards: Monitor customer churn rates, identify churn risk factors, and implement retention strategies.
Industry-Specific Dashboards
- Tech Companies: Focus on user acquisition, product usage metrics, customer lifetime value (CLTV), and churn rate.
- E-commerce Companies: Track website traffic, conversion rates, average order value (AOV), customer lifetime value (CLTV), and inventory management metrics.
- Fintech Companies: Monitor customer acquisition cost (CAC), customer lifetime value (CLTV), fraud detection metrics, and financial performance indicators.
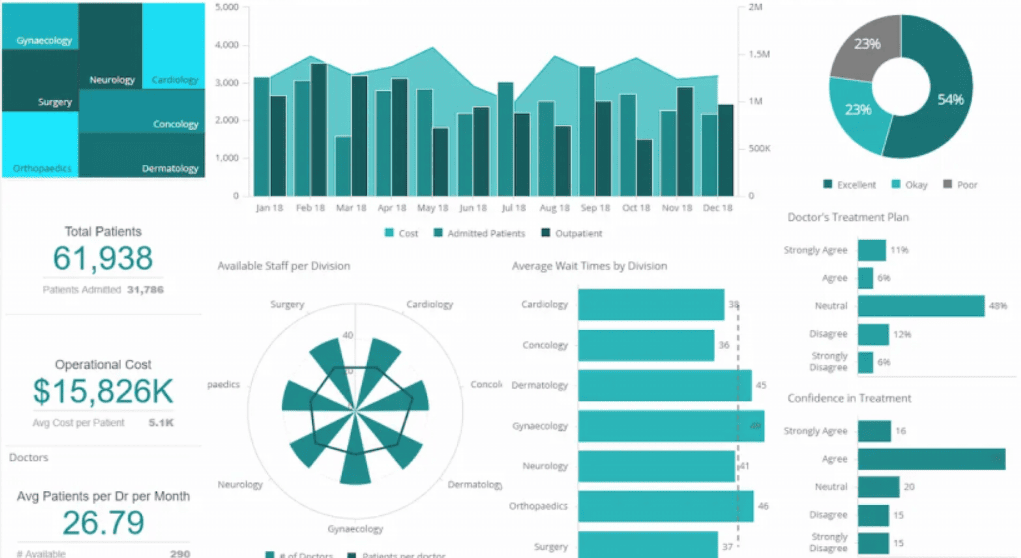
- Healthcare Companies: Track patient demographics, appointment scheduling, treatment outcomes, and patient satisfaction metrics.
Key Performance Indicators (KPIs)
These are the metrics that drive decision-making in Silicon Valley:
- Customer Acquisition Cost (CAC): The cost of acquiring a new customer.
- Customer Lifetime Value (CLTV): The total revenue a customer generates over their lifetime.
- Return on Investment (ROI): The return generated from an investment.
- Churn Rate: The rate at which customers stop doing business with a company.
- Net Promoter Score (NPS): A measure of customer loyalty and satisfaction.
- Conversion Rate: The percentage of website visitors who complete a desired action (e.g., making a purchase).
- Click-Through Rate (CTR): The percentage of users who click on a link or ad.
By leveraging these dashboards and KPIs, Silicon Valley companies make data-driven decisions, optimize operations and achieve sustainable growth. It's important to remember that the specific dashboards and metrics used can vary depending on the company's size, industry and strategic goals, even within Silocon Valley. For tailored and affordable digital solutions on analytics dashboards or other similar digital products, reach out to us for a free discovery session for possible solutions.