
In today's data-driven world, businesses of all sizes are generating vast amounts of information. Analytics dashboards provide a consolidated view of key performance indicators (KPIs) and metrics, allowing businesses to make informed decisions and track progress towards goals. This article explores common analytics dashboards, their benefits and use cases, implementation considerations, and key operational aspects, with a specific focus on consultancies and marketing agencies utilizing Erphub solutions.
Benefits of Analytics Dashboards:
- Improved Decision-Making: Dashboards present complex data in a clear and concise format, enabling faster and more data-driven decision-making across all levels of an organization.
- Enhanced Visibility: Real-time data visualization provides immediate insights into business performance, allowing for proactive adjustments to strategies and resource allocation.
- Increased Efficiency: Dashboards streamline data analysis by eliminating the need to manually comb through reports, saving time and resources.
- Improved Communication & Collaboration: Shared dashboards facilitate information sharing across departments, fostering better collaboration and alignment on goals.
- Boosted Client Confidence: Consultancies and marketing agencies can leverage dashboards to demonstrate the impact of their work on client KPIs, building trust and confidence.
Common Analytics Dashboards and Use Cases:
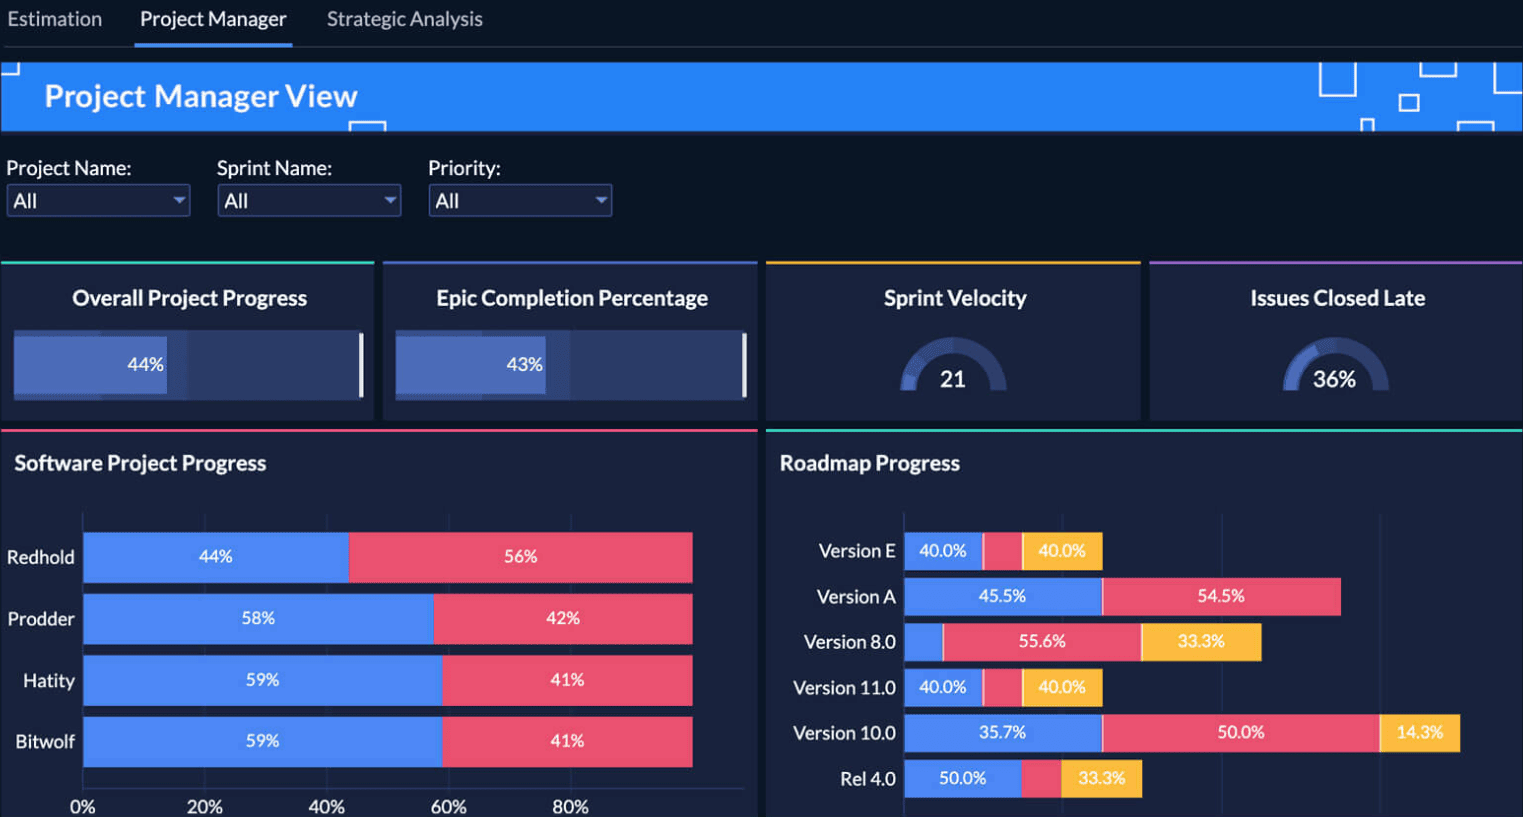
- Sales Performance Dashboard: Tracks sales pipeline metrics, conversion rates, and individual rep performance. (Use Cases: Identify sales bottlenecks, optimize sales processes, improve sales forecasting)
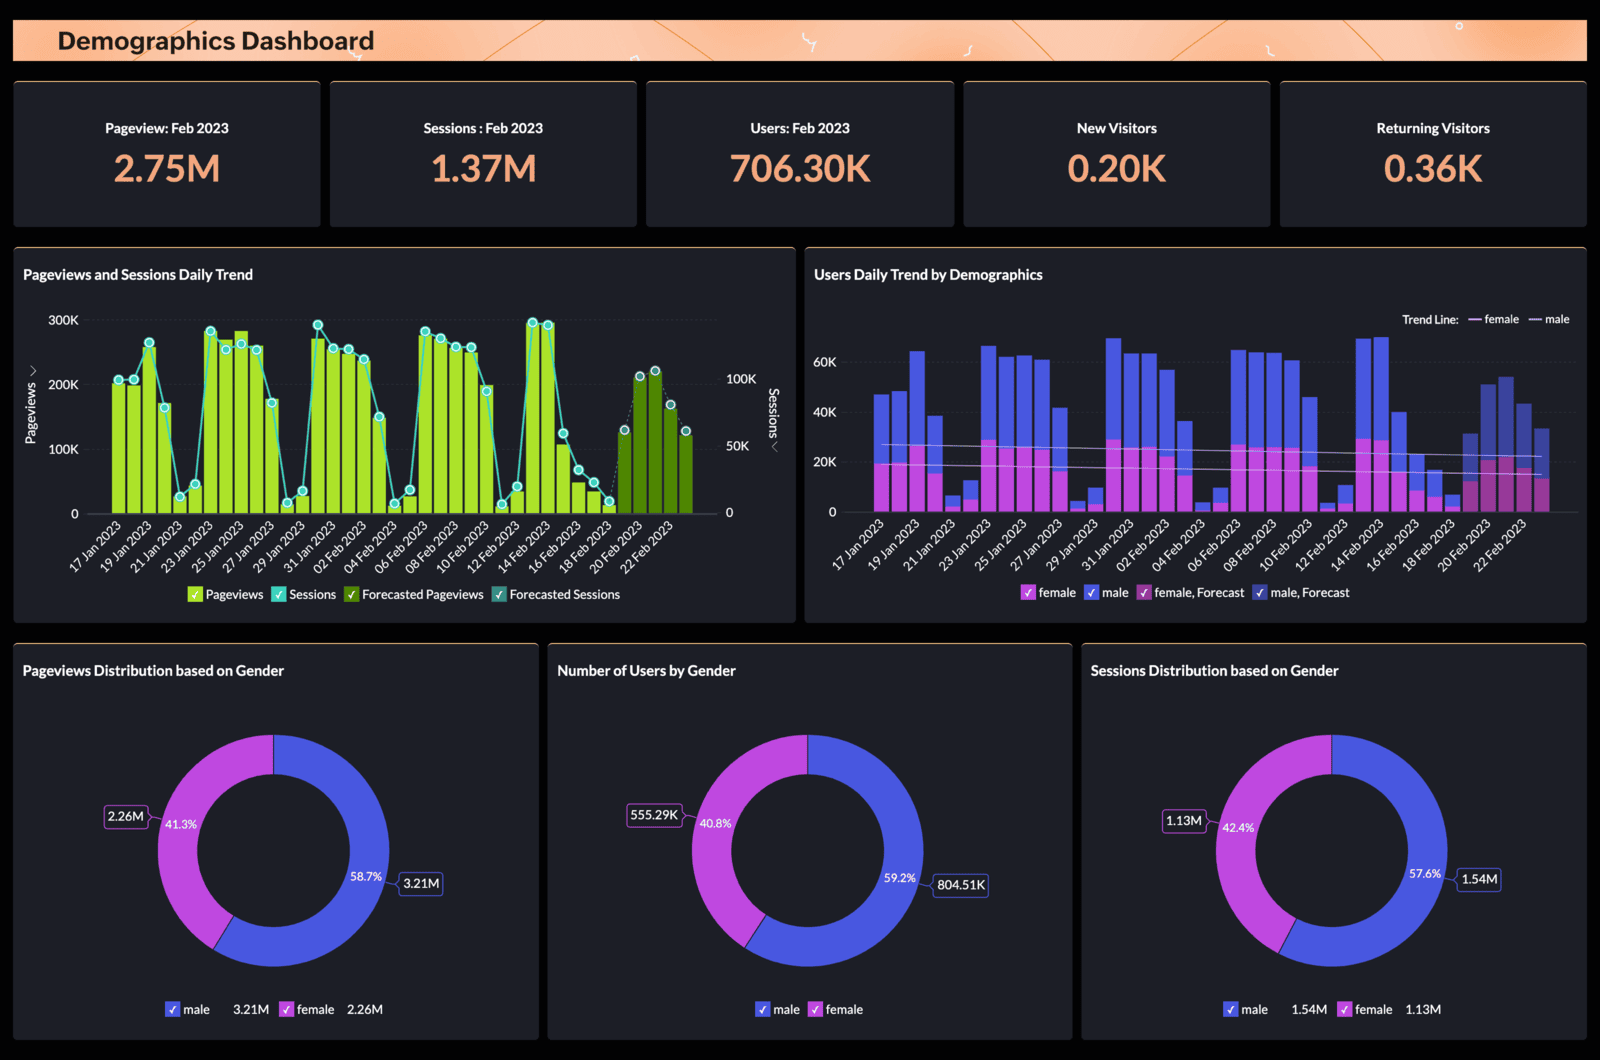
- Marketing Performance Dashboard: Monitors website traffic, campaign effectiveness, lead generation, and customer acquisition costs (CAC). (Use Cases: Analyze marketing ROI, optimize campaigns for better targeting, improve lead nurturing)
- Customer Satisfaction Dashboard: Tracks Net Promoter Score (NPS), customer satisfaction surveys, and support ticket data. (Use Cases: Identify areas for improvement, personalize customer communication, address customer concerns proactively)
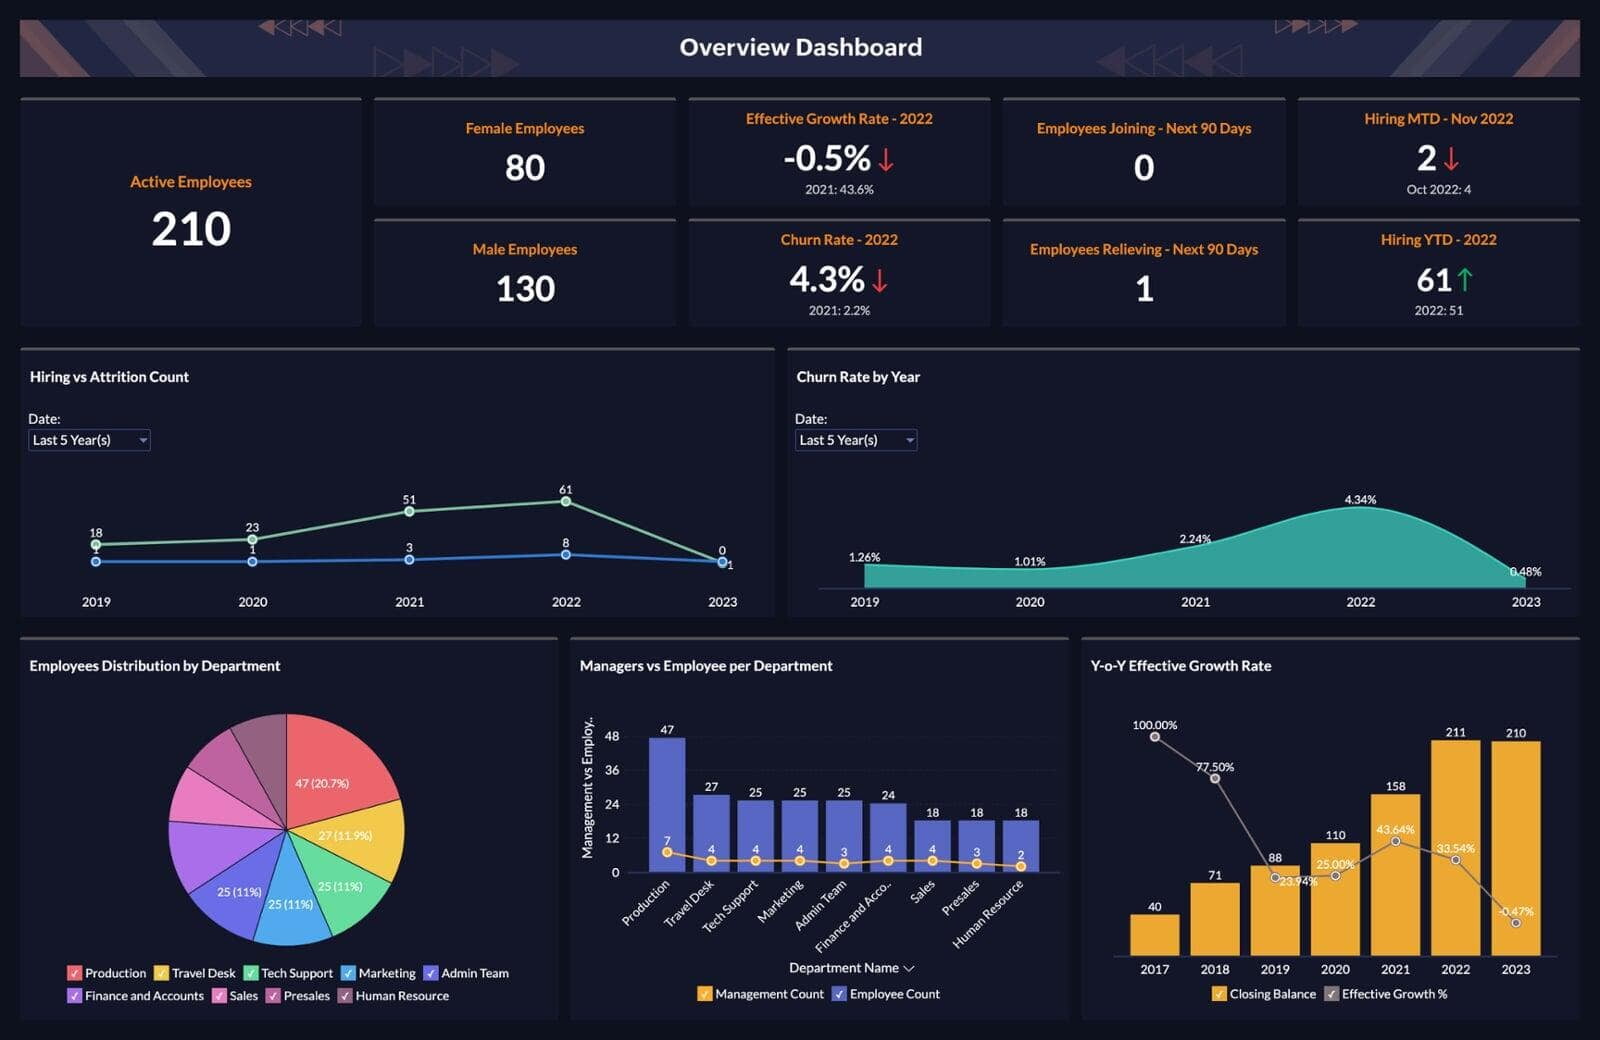
- Financial Performance Dashboard: Monitors key financial metrics like revenue, profitability, and cash flow. (Use Cases: Track financial health, identify cost-saving opportunities, make data-driven budgeting decisions)
- Social Media Analytics Dashboard: Tracks social media engagement metrics, follower growth, and brand sentiment. (Use Cases: Evaluate social media campaign effectiveness, identify key influencers, optimize content strategy)
- Predictive Analytics: Forecast future sales based on historical data and market trends. Identify at-risk deals and prioritize resources accordingly.
- Live Operations: Monitor real-time sales team activity, lead conversion rates, and competitor analysis to optimize sales strategies on the fly.
- Regression Models: Identify factors influencing customer acquisition cost (CAC) and optimize marketing campaigns for better return on investment (ROI).
- Predictive Churn Prevention: Leverage customer behavior data to predict churn risk and implement targeted retention strategies.
- Customer Satisfaction Dashboard - Sentiment Analysis: Analyze customer social media conversations and support tickets to identify emerging trends and potential dissatisfaction.
- Data Infrastructure: Ensure your data infrastructure can handle the increased volume and complexity of data required for advanced analytics.
- Data Science Expertise: Consider partnering with data scientists or leveraging AI-powered analytics platforms to extract maximum value from your data.
- Model Validation & Governance: Implement robust model validation and governance practices to ensure the accuracy and reliability of your predictive models.
- Key Operational Aspects for Advanced Dashboards
- Interactive Dashboards: Utilize interactive elements like drill-down capabilities and scenario planning to encourage user exploration and deeper data analysis.
- Automated Insights & Alerts: Set up automated alerts based on predefined thresholds for key metrics, prompting timely intervention when necessary.
- Data Visualization Techniques: Employ advanced data visualization techniques like heatmaps and scatter plots to reveal complex relationships within your data.
Implementation Considerations:
- Data Source Integration: Ensure seamless integration between your analytics platform and various data sources like CRM, marketing automation tools, and financial systems.
- KPI Selection: Focus on the most relevant KPIs that align with your business goals and target audience (consultants might prioritize client KPIs alongside internal performance metrics).
- Customization: Utilize customizable dashboards to tailor data visualizations and information to specific user needs and departments within your consultancy or marketing agency.
- Data Governance: Implement data governance practices to ensure data accuracy, consistency, and security within your dashboards.

Key Operational Aspects:
- Data Refresh Frequency: Determine the optimal refresh frequency for your dashboards to ensure data is up-to-date for informed decision-making.
- User Access & Permissions: Define user access levels based on roles and responsibilities within your organization.
- Alerts & Notifications: Set up automated alerts and notifications for critical KPIs that deviate from expected values, allowing for proactive intervention.
- Dashboard Sharing & Collaboration: Utilize features for sharing dashboards with clients or internal teams to facilitate collaboration and communication.
Erphub and Analytics Dashboards:
Erphub, a leading provider of Zoho solutions, empowers consultancies and marketing agencies with robust analytics tools like Zoho Analytics. Here's how Erphub can assist:
- Seamless Zoho Integration: Erphub ensures effortless integration between Zoho Analytics and your existing Zoho CRM, marketing automation tools, and other applications.
- Pre-Built Dashboards: Leverage pre-built dashboards for common business needs, or customize them to suit your specific use cases.
- Expert Support: Our team of Zoho specialists provides ongoing support and training to help you leverage the full potential of Zoho Analytics for creating and managing effective dashboards.
Conclusion:
In conclusion, common analytics dashboards play a vital role in business success. By leveraging the insights provided by these dashboards, consultancies and marketing agencies can make data-driven decisions, improve efficiency, and ultimately accelerate their clients' progress. Partnering with Erphub equips you with the tools and expertise to harness the power of analytics dashboards and drive your business, and your clients' businesses, forward.