
Service-oriented firms, consultancies, and marketing agencies rely on analytics dashboards to gain insights, optimize operations, and drive strategic decisions. Here are some of the most critical types of dashboards these organizations need:
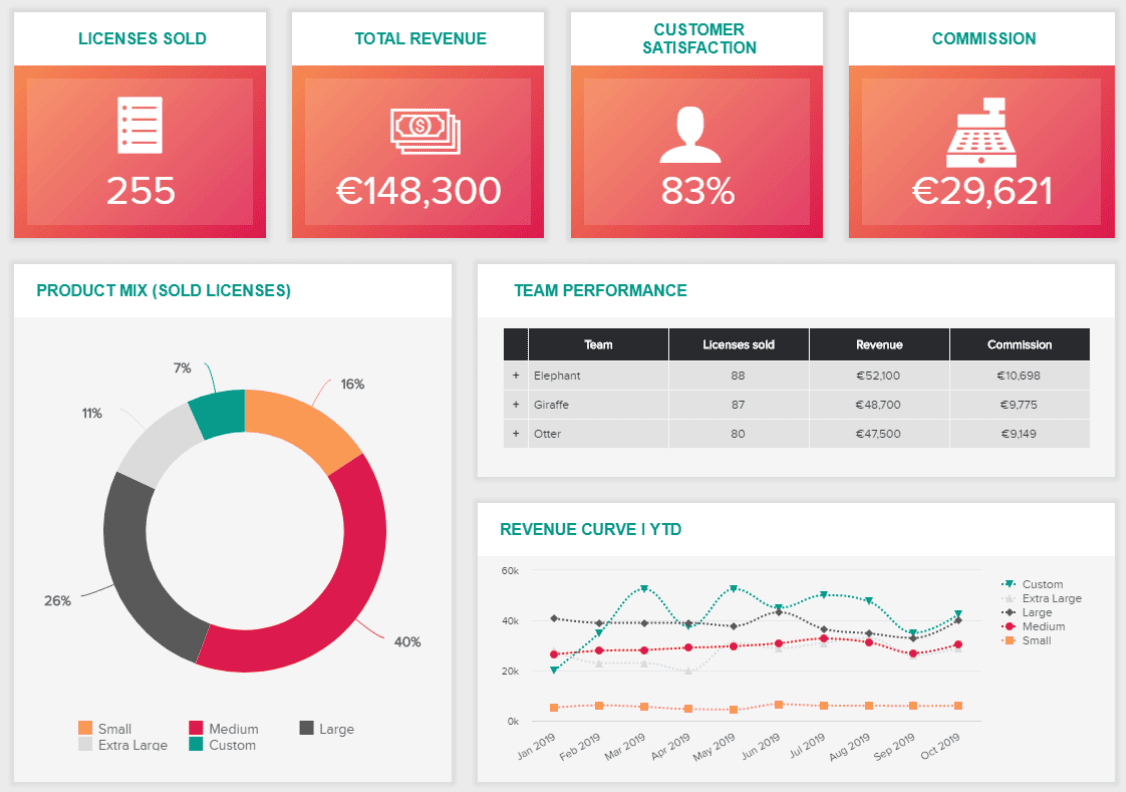
1. Client Performance Dashboard
Purpose:
To track and analyze the performance of client campaigns and projects.
Key Metrics:
- Campaign ROI
- Conversion rates
- Customer acquisition cost (CAC)
- Lifetime value (LTV) of customers
- Channel performance (e.g., SEO, PPC, social media)
Benefits:
- Provides insights into which campaigns are delivering the best results.
- Helps identify areas for improvement or optimization.
- Facilitates client reporting by offering clear, visual data presentations.
Challenges:
- Data Integration: Combining data from multiple sources to provide a comprehensive view.
- Customization: Tailoring dashboards to meet specific client needs and goals.
2. Operational Efficiency Dashboard
Purpose:
To monitor internal processes and resource allocation for maximum efficiency.
Key Metrics:
- Project timelines and milestones
- Resource utilization rates
- Budget adherence and variance
- Employee productivity and workload distribution
Benefits:
- Ensures projects stay on track and within budget.
- Optimizes resource allocation for improved productivity.
- Identifies bottlenecks and inefficiencies in workflows.
Challenges:
- Accuracy: Maintaining up-to-date data for real-time monitoring.
- Complexity: Managing diverse data sets from various departments.
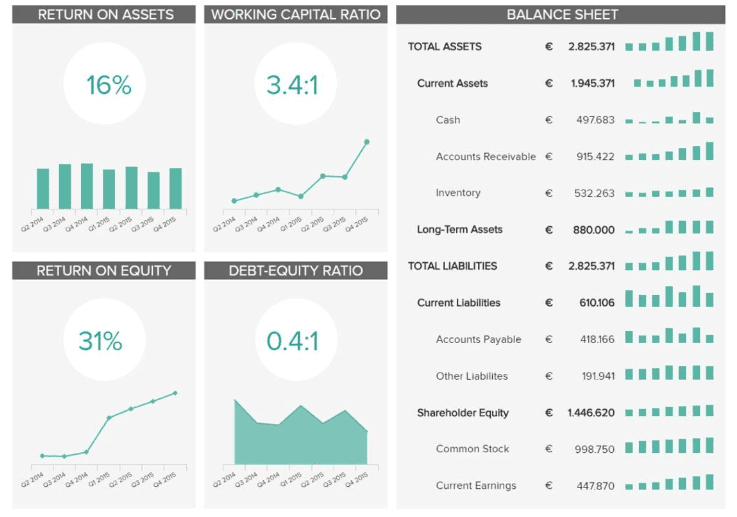
3. Financial Performance Dashboard
Purpose:
To provide a comprehensive view of the firm's financial health and performance.
Key Metrics:
- Revenue growth and trends
- Profit margins
- Cash flow analysis
- Expense tracking
- Forecasting and budgeting
Benefits:
- Enables data-driven financial planning and forecasting.
- Identifies cost-saving opportunities and areas for investment.
- Supports strategic decision-making with real-time financial insights.
Challenges:
- Data Security: Ensuring sensitive financial data is protected.
- Scalability: Adapting dashboards as the firm grows or financial structures change.
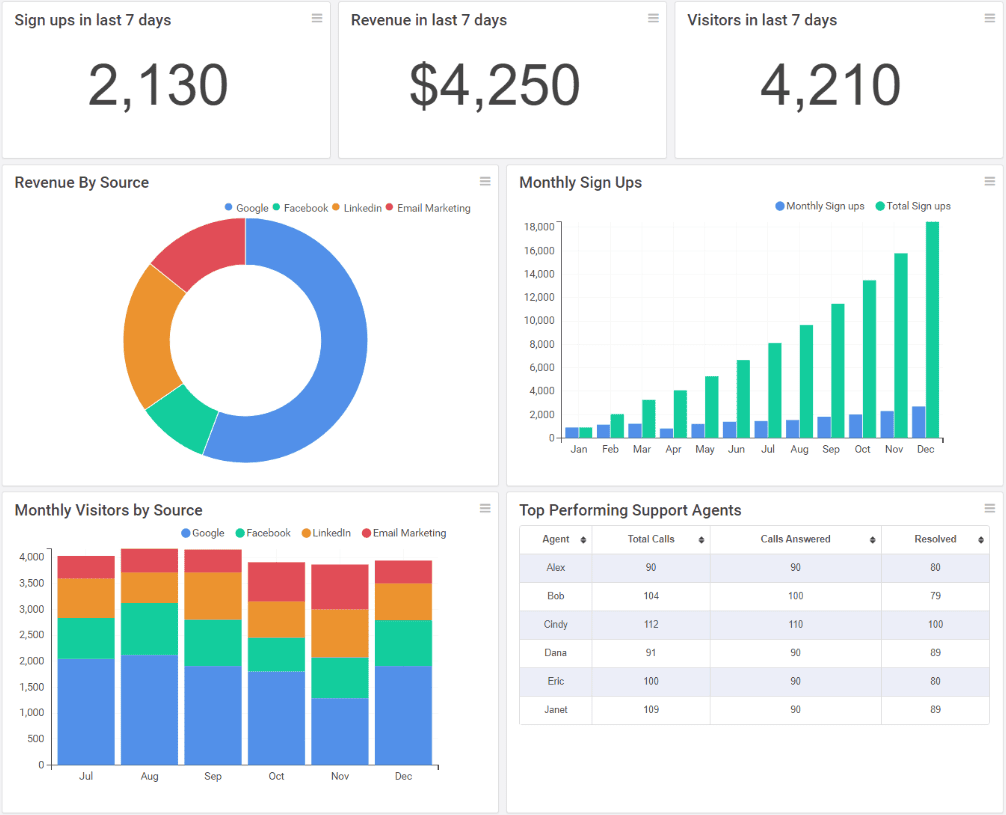
4. Client Administration, Interaction, and Engagement Dashboard
Purpose:
To analyze client interactions and engagement levels across various channels.
Key Metrics:
- Client communication frequenement rates (e.g., email open rates, social media interactions)
- Client satisfaction scores
- Net Promoter Score (NPS)
Benefits:
- Enhances client relationships by understanding engagement patterns.
- Identifies high-value clients for targeted outreach.
- Helps tailor communication strategies to improve client satisfaction.
Challenges:
- Consistency: Ensuring consistent data capture across all interaction channels.
- Interpretation: Making sense of qualitative feedback alongside quantitative data.
5. Market and Competitor Analysis Dashboard
Purpose:
To keep track of market trends and competitor activities.
Key Metrics:
- Market share analysis
- Competitor performance benchmarking
- Emerging industry trends
- SWOT analysis of competitors
Benefits:
- Informs strategic planning with insights into market dynamics.
- Identifies opportunities for competitive differentiation.
- Supports proactive decision-making in response to market changes.
Challenges:
- Data Accuracy: Ensuring market data is up-to-date and reliable.
- Integration: Combining internal data with external market information.
6. Talent and Human Resources Dashboard
Purpose:
To manage and optimize the workforce and HR functions.
Key Metrics:
- Employee turnover rates
- Hiring pipeline and recruitment metrics
- Employee satisfaction and engagement scores
- Training and development progress
Benefits:
- Improves talent retention and development strategies.
- Aligns HR practices with organizational goals.
- Provides insights into workforce dynamics and potential areas of concern.
Challenges:
- Privacy: Protecting sensitive employee data.
- Engagement: Encouraging active use of HR analytics for decision-making.
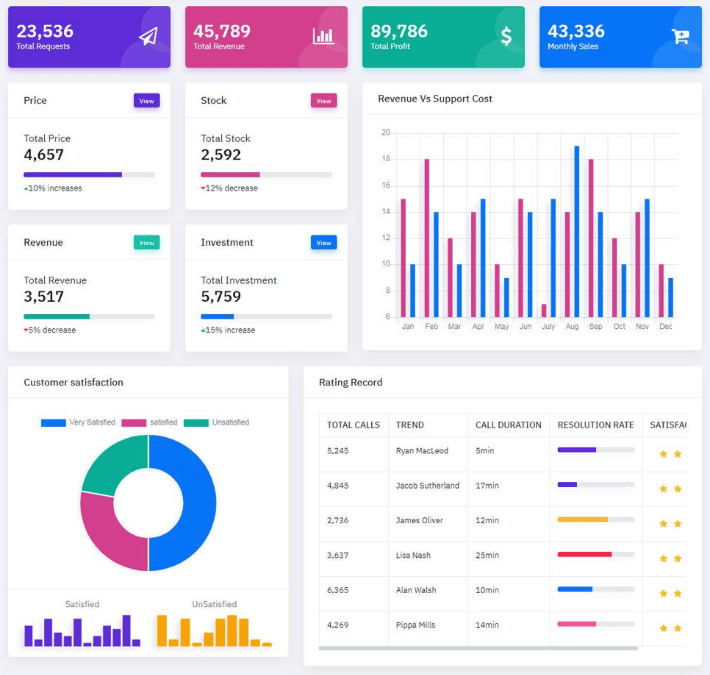
7. Customer Experience Dashboard
Purpose:
To monitor and enhance the overall customer experience.
Key Metrics:
- Customer journey analysis
- Customer satisfaction and feedback
- Response times to inquiries and issues
- Service level agreement (SLA) compliance
Benefits:
- Improves customer satisfaction by addressing pain points.
- Provides insights into the customer journey for enhanced experience.
- Supports continuous improvement efforts based on customer feedback.
Challenges:
- Complexity: Analyzing diverse touchpoints across the customer journey.
- Data Integration: Combining qualitative and quantitative feedback for a holistic view.
Implementation and Usage Challenges
Data Integration: Successfully integrating data from various sources (e.g., CRM, marketing platforms, financial systems) to create a unified view is a common challenge.
Customization: Customizing dashboards to meet the specific needs and goals of different departments or stakeholders while maintaining consistency in design and functionality.
Real-Time Updates: Ensuring dashboards are updated in real-time or near-real-time to provide the most accurate and actionable insights.
User Adoption: Encouraging stakeholders to use dashboards regularly by making them intuitive, user-friendly, and aligned with their objectives.
Data Security: Implementing robust security measures to protect sensitive data and ensure compliance with regulations.
Scalability: Designing dashboards that can scale with the organization's growth and adapt to changing business needs.
Conclusion
Addressing the challenges associated with data integration, customization and user adoption is crucial for maximizing the benefits of these tools. Erphub has helped businesses from across industries with tailored and affordable digital solutions. Get in touch for a free discovery session for automatons, analytics dashboarding or any digital solutions you may be looking up for any part of your business!